In my lifetime, the size of sophisticated audio analysis systems has evolved from table top, to under-airplane-seat, to computer bag, to cell phone. The cost has evolved from the price of a nice automobile to that of a Happy Meal.
As such, there are more audio practitioners than ever equipped to perform sophisticated loudspeaker and room measurements. Those who make the decision to get serious about this are faced with the daunting task of learning the ropes in order to get meaningful data from their measurement platform.
It comes down to signal processing, and the theory and principles are not unique to audio and acoustics. They are used by virtually every engineering field, and even spill into seemingly non-technical fields such as accounting and photography. Audio practitioners use software and hardware tools with deep signal processing roots.
The good news is that textbooks and websites regarding every part of the measurement process are plentiful. The bad news is that you can Wikipedia-yourself until kingdom come and never cover it all. You will also find that the rigid definitions may not even seem to apply to audio, since they were not developed to measure audio systems. In many cases they are presented in the most concise form possible – as mathematical equations.
I decided to cook up a glossary of some of the terms most frequently encountered when working with audio analyzers of all types. Since acoustic analyzers analyze audio signals, this glossary applies to them, too. I have relaxed the rigidity to communicate the concepts, resulting in definitions that, while less general, are more applicable to how audio practitioners use them. It is my hope that this will help you better understand your measurement platform of choice.
As one engaged in both web-based and in-person training, I have the benefit of observing first hand how those new to the field wrestle with these principles. I get lots of questions on a daily basis. I learned long ago that “What one is wondering, many are wondering.” In the future I can refer the investigator to this document when they are wrestling with getting meaningful data from their measurement platform.
These are ordered in a way logical to learning measurement from the ground up, starting with general terms and then including the more esoteric. I wrap with a concise description of a real-world measurement session, using all of the terms from the glossary. Here we go…
General Terms
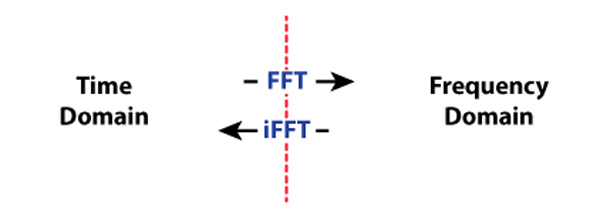
Signal Domain – The X-axis (horizontal) of a 2D plot of an audio waveform, usually a captured impulse response (IR). The strength of the signal is plotted on the Y-axis, either in linear units (pressure or voltage) or as a level in dB. The two domains most often used to analyze signals are the time domain and the frequency domain (Figure 1).
Fast Fourier Transform (FFT) – A mathematically efficient algorithm for determining the spectral content (frequency domain) of a time domain waveform. In measurement work, the FFT is usually performed on the impulse response (Figure 2).
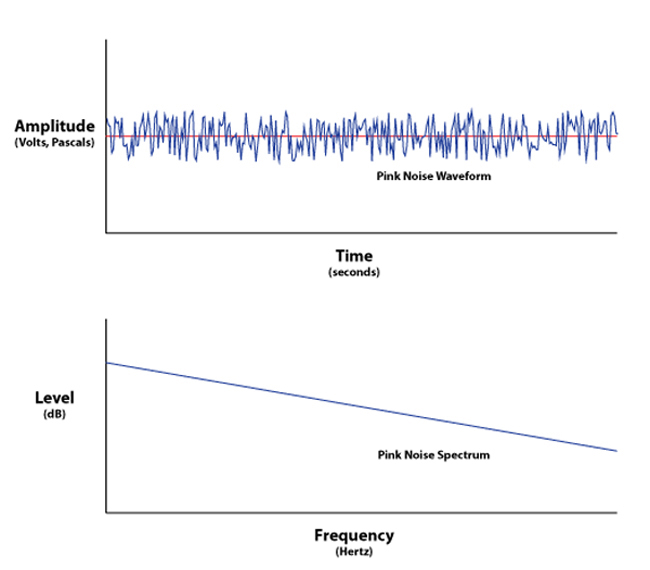
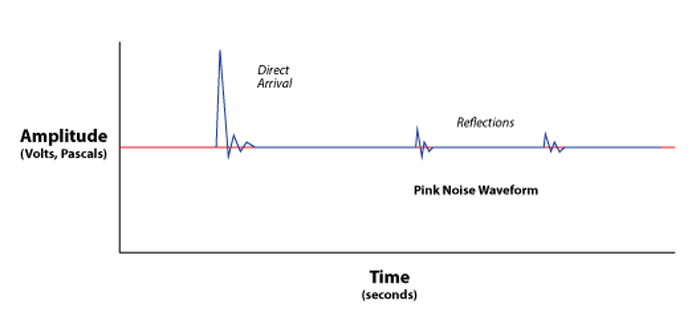
Impulse Response (IR) – A display of the signal amplitude vs. time of an impulse that passes through the system. Acoustic examples include handclaps and balloon pops in a room. It is the inverse-FFT of the transfer function, which can be captured using non-impulsive stimuli (e.g. pink noise or log sweep) (Figure 3).
Log-Squared Impulse Response – A time domain plot that results from rectifying the IR and displaying it on a log vertical axis. It displays the relative levels of the various events, making it easier to judge whether or not an event is significant (audible) (Figure 4).
Envelope-Time Curve (ETC) – Formerly the Energy-Time Curve, it displays the envelope of the impulse response. It is a sort of “smoothed” log-squared response, and can aid in interpreting it. Note that the term “ETC” is used loosely in measurement, and its exactly meaning is specific to the analysis platform (Figure 5).
Time Window – A technique used to limit the application of the FFT to only part of the impulse response. This yields the transfer function for only part of the time record. A time window can be used to reduce the effects of room reflections on the transfer function, effectively allowing anechoic loudspeaker measurements to be made indoors.
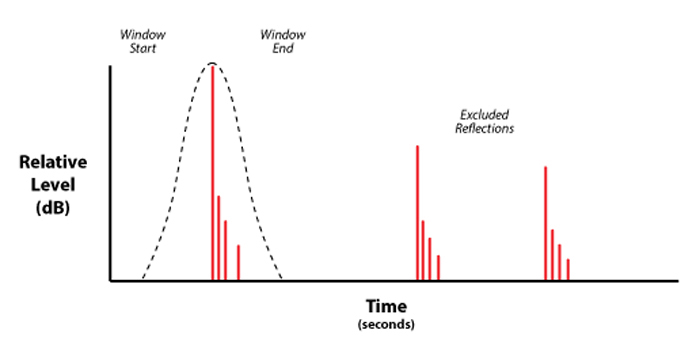
Symmetrical Time Window – Symmetrical time windows are used when there is significant energy on both sides of the direct sound arrival of the impulse response that must be rejected from the FFT. It is usually centered around the direct sound arrival (Figure 6).
Shaped Time Window – A time window that is tapered at its edge(s) to avoid abruptly interrupting the time domain data. A symmetrical time window is tapered at both ends. There are various time window “shapes” available (e.g., Hann, Hamming, Blackman-Harris, etc.) (Figure 7).
Half-Window – A time window that is tapered on the trailing edge only. Half-windows are used when the impulse is near the start of the time record, where there is very low energy ahead of the impulse arrival. Here the use of a symmetrical window is either unecessary or it could exclude the direct field arrival (Figure 8).
Asymmetrical Time Window – A time window that is not tapered (rectangular) at the leading edge, but tapered at the trailing edge. The leading edge of an asymmetrical time window must always be placed before the impulse arrival (Figure 9). The leading edge of a half-window can be placed after the arrival of the impulse (Figure 8). The half-windows implemented by many analyzers are actually asymmetrical windows, and you will not find universal agreement on which is the “correct” implementation.
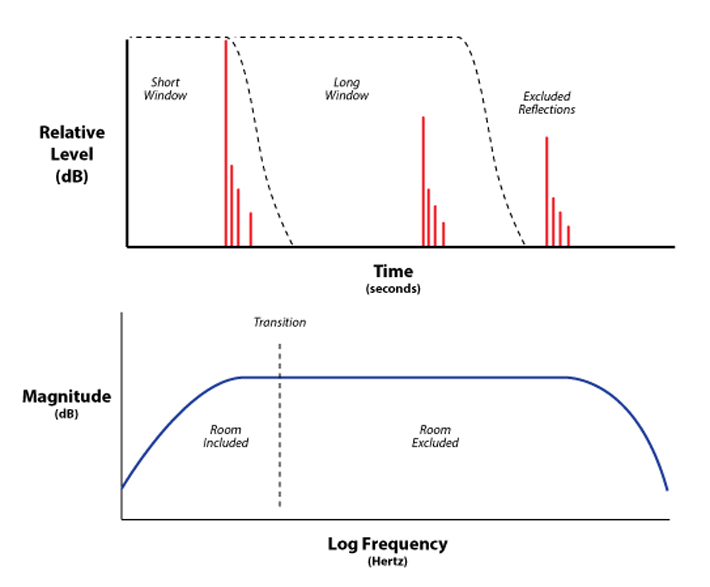
Dual or Multi-Time Windows – The use of more than one time window length. This allows the room reflections to be excluded from the high frequency response, but allows the room into the measurement for computation of the low frequency response. This appears to emulate the way that humans perceive sound. In effect, at low frequencies (long wavelengths) the contribution of the room reflections become part of the woofer’s response, and cannot be separated from it, either by the listener or the analyzer (Figure 10).
In general, symmetrical time windows are used by analyzers that collect the real-time transfer function. Half-windows are usually used when the operator manually selects the portion of the impulse response to be transformed to the frequency domain (using cursors). The objective of all window types is to produce a frequency response magnitude response that is free of comb filters (frequency response ripples caused by the phase interaction of multiple sound arrivals), leaving the part that can be meaningfully improved using an electronic equalizer.

