A client wants to play folk music in a coffee shop.
How much amplifier power is needed?
A rock group will be playing in a 2,000-seat concert hall.
How many watts will you need to provide?
A jazz-fusion group bought some loudspeakers, and want to play them as loud as they can get without blowing them up.
Which amplifier should you recommend?
Questions such as these arise in any sound system design. To help you specify an optimum amount of amplifier power for a system, I’ll explain the relevant audio concepts here.
There are two goals:
1) Power the loudspeakers so they play as loudly as possible without burning out. In other words, determine the optimum powering for the chosen loudspeakers.
2) Achieve a certain loudness in a certain venue.
We’ll cover both topics.
SIGNAL LEVELS
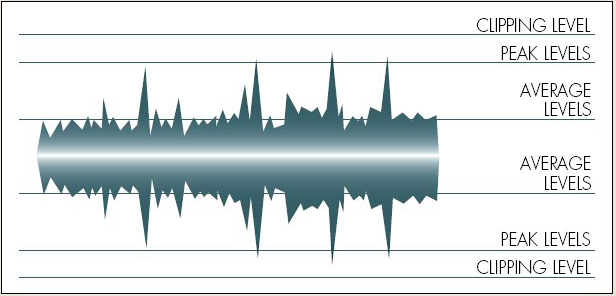
First let’s review the concept of average levels and peak levels. As shown in Figure 1, a musical signal changes in level (voltage) continuously as it plays.
Imagine a musical passage with a low-level synth pad, but with high-level drum hits. The average level or volume of the passage is low, but the transient peak levels are high.
Peak levels may be up to 24 dB above average levels depending on the type of signal. Percussive sounds have much higher peaks than continuous sounds do (synth pads, organ, flute) – even if the two signals have similar average levels. The peak-to-average ratio of the signal is called the crest factor or peak factor.
In other words, crest factor is the difference in dB between the peak levels and the average level of the signal.
Percussive sounds have a high crest factor. Flutes, organs and violins have a low crest factor.
See Figure 2. It is a graph of signal level versus time when the amp is fed a typical musical signal. The average level corresponds to the signal’s loudness. The peak level is 6 to 24 dB above the average level, depending on the type of signal. In other words, the signal crest factor is 6 to 24 dB.
Headroom — In Figure 2, headroom is the difference in dB between the signal peak levels and the amplifier’s clipping level. Normally you want to allow at least 3 dB of headroom so that signal peaks don’t accidentally clip.
Peakroom — This term, coined by Pat Brown of SynAudCon, is crest factor plus headroom. Peakroom indicates how many decibels that peaks can be above the average level without clipping.
POWER AMP SPECS
Now that we understand signal levels, let’s see how they relate to power amp specifications.
Continuous Average Power — The power specification of most amplifiers is continuous average power. That’s the maximum power in watts that the amplifier can produce at rated distortion, at a certain load impedance, when playing a continuous sine wave. That sine wave signal is either a 1 kHz tone or is a range of tones from 20 Hz to 20 kHz.
For example, one amplifier puts out 1,800 watts per channel into 4 ohms in stereo mode at 0.1 percent THD at 1 kHz. Another amp produces 8,000 watts into 8 ohms in bridge-mono mode at 0.35 percent THD from 20 Hz to 20 kHz.


