
I’m a huge fan and longtime user of Rational Acoustics Smaart audio measurement software. In the 1980s through the early 90s, I tuned systems using only my ears (and a real-time analyzer or RTA for short), but after being introduced to Meyer Sound SIM 2 source independent measurement analyzer, along with the great optimization skills of my audio mentor, Dave Lawler (a.k.a., Dr. Dave), I decided I had to get onboard with this great synergy of art and science so I purchased Smaart software along with an audio interface and a reference microphone – and I haven’t looked back.
Whether you’re a fan of SIM or Smaart (or any other FFT-based measurement system) you’ve mostly likely found that over time you’ve become quite dependent on using the data supplied by this tool to help in making choices when tuning, time aligning and balancing levels throughout systems.
If you have the depth of experience to decipher what the data is telling you, then by all means lean heavily on the data, but I’d like to issue a word of warning to the user who is staring at the screen, not really understanding what is being revealed, and making EQ choices based on this data.
Learning to use FFT measurement software and trust the results of interpreted data takes a lot of time and practice, but it’s worth it if you’re in for the long haul. Let’s look at a couple of pitfalls that I recommend avoiding as you become a more experienced user and optimizer of sound systems.
Understanding Transfer Function
The way I have my main screens set up on Smaart, I bounce between the “SPECTRUM” screen and the “TRANSFER FUNCTION” screen.
In “Spectrum Mode,” the display shows two separate vertical “RTA-like” frequency response traces, one being the input from the console (or source), and the second representing what the mic is “hearing” in the room.
If I run pink noise through the system, the “Source” trace tends to look almost completely flat while the “Mic” trace will show the dips and bumps in the frequency response of the PA as the mic hears it.
In “Transfer Function Mode,” the “Source” and “Mic” traces are replaced with a single horizontal trace that displays the “difference” of the two traces in graphic form. In a perfect anechoic world where the system is completely equal in frequency response from 20 Hz to 20 kHz, the screen would display a flat line… not likely. Reading the valleys and peaks in the Transfer Function graph provides us with an idea of which frequencies are building up and which ones are missing in the overall frequency response.
Knowing The Difference
With this premise in mind, one would think that a “flat” Transfer Function graph with a little bump in the sub area would sound pretty good. Well, it certainly can, but the most important thing to remember about the Transfer Function trace is that it’s only showing the “difference” between what’s coming out of the console and what the mic in the room is hearing. If the mix sounds great, and the Transfer Function trace is flat, then all is well, but to put it rather bluntly, if the mix is really awful and the trace is flat, it simply means that the system sounds the same as the mix; in other words, awful!
A useful test that brings this to light is to engage an EQ on the master L/R of the console, boost a few frequencies in the high-mids (everyone’s favorite), and take a look at the Transfer Function display on Smaart. You’ll notice that even though the PA now sounds horrific, the Transfer Function is still pretty flat. It’s because what the console and loudspeakers are producing are fairly similar…but that doesn’t mean it sounds good. Use pink noise, achieve a flat Transfer Function, then construct an even frequency mix on the console, and you’ll likely find what you’re looking for.
Deciphering Phase & Coherence
Let’s shift gears and discuss Phase and Coherence traces. Another pitfall when using Smaart is not quite understanding what these traces are telling you. Smaart is relatively easy to use in its simplest form, and wonderfully revealing and helpful when you incorporate the Phase and Coherence trace.
In basic terms, coherence indicates how likely it is that the data we’re seeing on screen was caused by the test signal, rather than a noise source such as a forklift, moving lights, or late reverberant energy. I frequently tell folks that the Coherence trace is essentially displaying a measurement of the “reliability” of the data. If this trace is high (near 100 percent), then Smaart feels confident that the mic is “hearing” a valid representation of the source (pink noise – or the mix). We can feel more comfortable making tuning decisions based on this data.
However, if the trace has a large section where it dips to a much lower percentage, then it’s essentially saying that something is happening in this region that is “confusing the software,” such as a strong reflection or multiple versions of the same source. This can happen if the reference mic is positioned closer to the house right side of the PA while the house left side is also on during measurement. The mic hears two versions of the same source (that are not time aligned), so the coherence trace “dips” in an effort to display the confusion caused by these multiple sources.
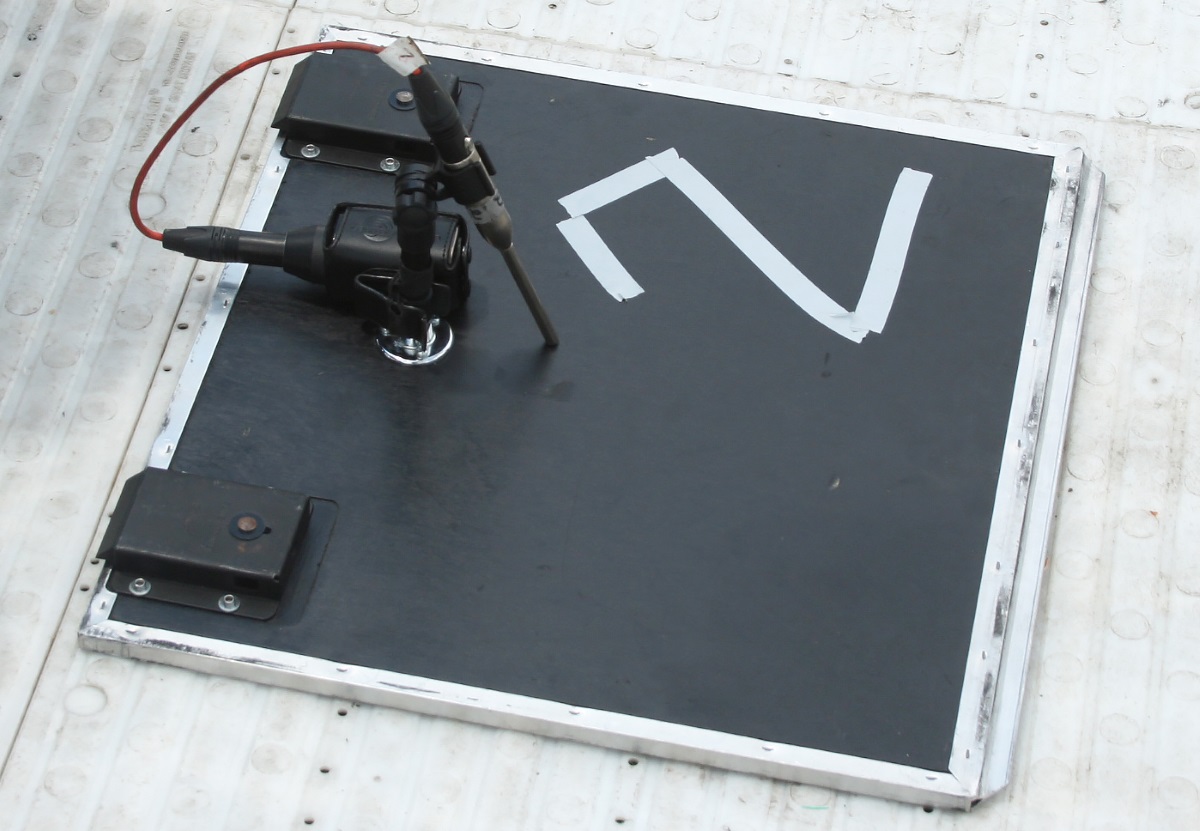
This is one reason we see techs place their reference mic tip down on the ground while taking measurements. It eliminates the floor bounce that causes Smaart to hear the direct signal from the PA along with the bounce off the floor, which can cause the software to “wonder” why it’s hearing two different versions of the same source.
The Phase trace is a little more complicated but can also be a “keeping things honest” indicator. Put simply, it shows the arrival time of the measurement signal compared to the reference signal. If you take a reading, and then move the mic 25 feet to take another reading but forget to redo the “Delay Finder” measurement, the phase trace and coherence will suddenly go horribly wrong. When you again get the source delayed back to the mic using “Delay Finder,” the traces should come back together and look much prettier. (A more thorough discussion of other uses of the Phase Trace should be left for another time.)
I Can Fix This…
Smaart, when used properly, is similar to the best power tool in a toolbox to help get the entire system time aligned, level balanced and tuned up. But keep in mind that its main job is to display the reality of what the source is outputting and what the mic is hearing. It’s data, and only data.
Our ears should always be the last line of defense when deep in battle with a system, especially in a tough room. If Smaart is showing a lovely graphic display but the system just doesn’t sound right, quickly take some photos for uploading to social media, then remember that it could be the console mix that has drifted. Grab a pair of headphones and make sure what’s coming out of that expensive mixing desk is really what you want to hear through the loudspeakers!
Modern sound systems are pretty amazing, so if what you’re hearing is not quite as epic as desired, the first order of business may be a pair of headphones and a half hour with a multitrack session, not a hack job on the PA system EQ.