T60SR6 Target Goal
The focus of this thesis is the decay time ratio of naturally occurring reverberation found in fully enclosed buildings, when unoccupied. Again, the primary application is directed toward live performance venues, configured with, and using sound reinforcement systems.
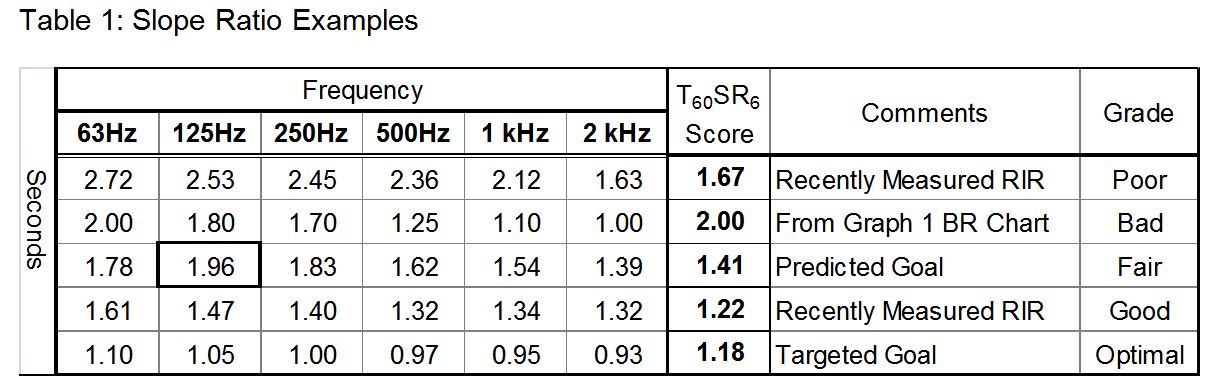
It is proposed here that to achieve an “optimal” T60SR6 grade, the SR score must fall between 1.10 and 1.20. See Table 2 below for a complete listing of scores and grades.
Regardless of a venue’s mid-band T60 requirements, it is believed the T60 Slope Ratio thesis remains a consistently viable metric. In some traditional church settings a desired, average speech-range T60 might be 1.50 seconds. Given that, or any other mid-band prerequisite, the T60SR6 goals do not change.
Slope Asymmetry
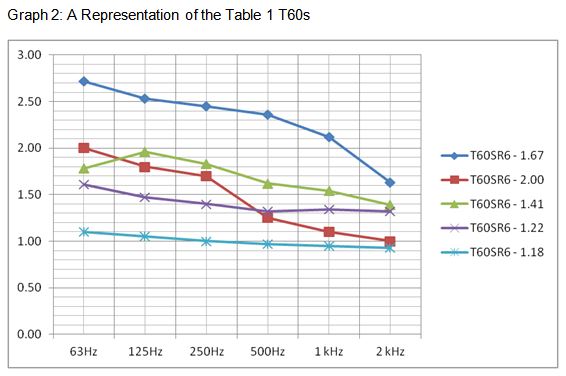
It is fairly common that T60 times gradually descend from longest to shortest, starting with the longest at 63 Hz. See examples in Graph 2 below. But, this is not always the case. Slope asymmetry may show longest or shortest times at any of the six octave centers.
As an example, a room may have a 1.50 second T60 at 63 Hz and a 1.25 second T60 at 2 kHz, but a 1.90 second T60 at 250 Hz. Applying the math (defined below) to the two bookend frequencies would result in a SR of 1.20, which would appear to be optimal. However, if we calculate for the longest and shortest times, regardless of the octaves in which they fall, the result is 1.52. This ratio is graded “poor,” and special room treatments should be specified to address the asymmetry.
Therefore, the formula for calculating the SR should be factored from the longest and shortest times, not simply the lowest and highest octave centers. It is also proposed that the acceptable time deviation between any two adjacent octave centers be limited to +/- one tenth (0.10) of one second.
The Math
The math is very simple. To find the ratio, divide the longest T60 by the shortest T60.
Example: If a 63 Hz T60 of 1.90 is divided by the 2 kHz T60 of 1.20, the resulting ratio is 1.58:1.
Put another way, in this example the 63 Hz T60 lasts 1.58 times longer than the 2 kHz T60, which is a poor result.
Bass Ratio vs. Slope Ratio
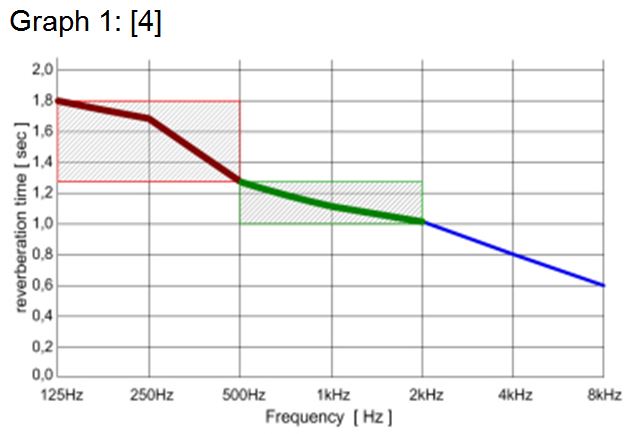
Leo Beranek developed the concept of the Bass Ratio, and recommended it be applied to classical concert halls. Bass Ratio (BR) is the proportional relationship between the summed T60s of the 125 Hz and 250 Hz octave bands, divided by the summed T60s of the 500 Hz and 1 kHz octave bands. The formula is quite simple: BR = (RT125Hz + RT250Hz) / (RT500Hz + RT1kHz). Graphically, a BR T60 plot looks something like this:
In practice, Bass Ratio and Slope Ratio goals are conflicting concepts. Bass Ratio goals and calculations were developed to quantify and support the idea that acoustic instruments need a little extra help from the room in the low frequency range.
Slope Ratio goals and calculations support the notion that those same frequencies, and below, should not be boosted.
Longer low and VLF T60s are not needed or desirable when an extended-range sound reinforcement system is being used. Further, the BR calculations only look at four octaves of data. It is suggested here that four octaves is insufficient given modern musical styles and technologies.
Using Graph 1 above, the Bass Ratio works out to be 1.49:1. Using the same chart, the SR could easily be 2.50:1, if we presume a 2.0 second T60 at 63 Hz.