
The reason the fast Fourier transform (FFT) gets so much attention in audio is that it allows us to look under the hood of a complex waveform and discover what frequencies are present. The converse is also true: by combining sine waves of various frequencies and phases, we can create any waveform we like. This is how additive synthesizers and Hammond organs work, for example.
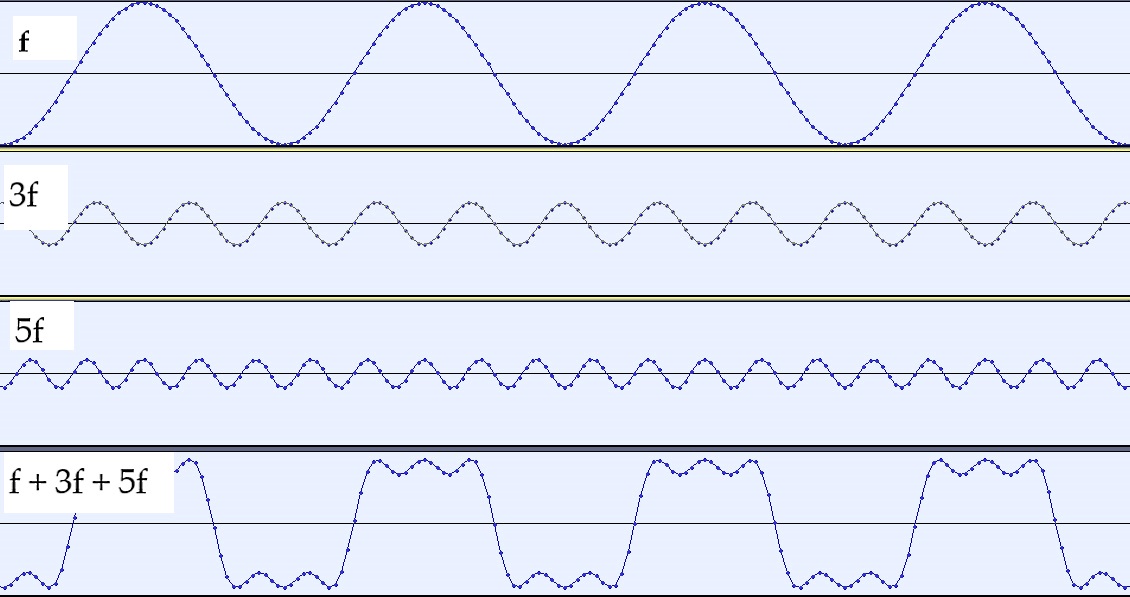
Square waves consist of a fundamental frequency f combined with odd harmonics 3f, 5f, 7f, and so on, decreasing in amplitude as they go. Figure 1 shows a 1 kHz sine wave combined with the first two odd harmonics at 3 kHz and 5 kHz to form the beginnings of a square wave.
To have perfectly vertical edges and perfectly flat tops, a square wave must contain frequencies to infinity. Maybe in the next firmware update.
Real-world square waves are band-limited by the audio system and thus can look a little wobbly. This is often misinterpreted as ringing imparted by a filter, but it’s actually just the result of the system having a non-infinite high-frequency response. (This concept is known to mathematicians as the Gibbs phenomenon.)
Since every frequency present plays some role in defining the overall shape of the composite signal, we can’t change one without changing the whole. It can be challenging to realize that we’re talking about the same concept from two perspectives: adding, removing, or altering any of the component frequencies results in a different composite waveform, and any time we change the shape of a waveform, we’re also modifying the sine wave components in some way – either by changing which component frequencies are present, or changing their amplitude or phase.
Going Deeper
Let’s take this out of the realm of theory and look at a practical situation: what happens when we clip a signal?
The following was inspired by a much more in-depth exploration by console designer Douglas Self in his book Audio Power Amplifier Design. In studying Self’s work, I found the concept interesting enough to do some experiments of my own. For me, getting hands-on with a given subject matter brings a deeper level of understanding than I could achieve by just reading about it.
The audio files used here were generated using freeware audio editor Audacity. I enabled the “connect the dots” view option so the waveform on the screen visually resembles what would appear at the output of a digital-to-analog converter (DAC), but remember that in the digital realm, amplitude data only exists at the sample points, indicated by circles, and not in between.
Figure 2 provides a look at a series of audio files presented in two ways: the waveform on the left and the signal’s spectrum on the right. Note that I used a linear frequency scale for the spectrum analysis, which allows a visually natural spacing for the harmonics. We don’t hear this way, but it’s easier to see what’s going on.
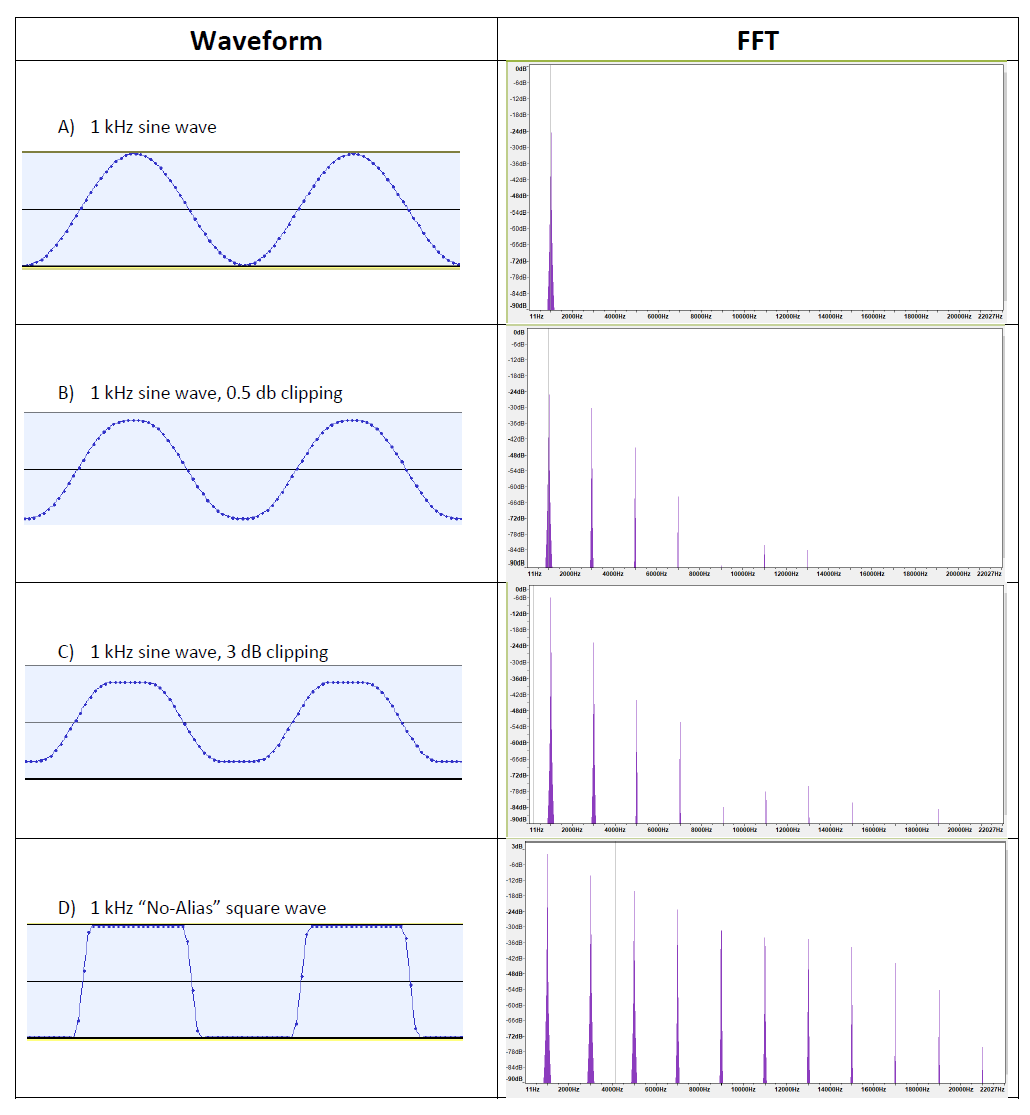
In Figure 2A, the FFT confirms that our 1 kHz sine wave is pure and has all its energy concentrated about 1 kHz. In Figure 2B, I applied only 0.5 dB of clipping using Audacity’s limiter. (Clipping and limiting are not exactly the same, and Audacity’s plugin offers both functions.) This slightly flattens the peaks of the waveform. The FFT reveals that even this small change results in the addition of significant energy at the first few odd harmonics, most prominently 3 kHz, 5 kHz, and 7 kHz. Figure 2C shows the result of 3 dB of clipping, adding more energy further up into the spectrum.
Compare this with Audacity’s generated “no-alias” square wave (Figure 2D), a band-limited version of a square wave that avoids the visual nastiness of running a mathematically true square wave through an FFT with finite frequency resolution.
We see that as clipping becomes more severe, the signal increasingly resembles a square wave. Besides creating an unpleasant sound, there is the additional real-world ramification that square waves contain twice as much power (“area under the curve”) as sine waves of the same peak amplitude.
Running an amplifier into clipping can therefore cause a connected loudspeaker to overheat much faster.
Not Created Equal
It pays to bear in mind that we’re looking at digitally generated and manipulated test tones, and the real world is rarely so “cut and dry.” Accordingly, I also analyzed the clipped output signals from several actual audio devices.
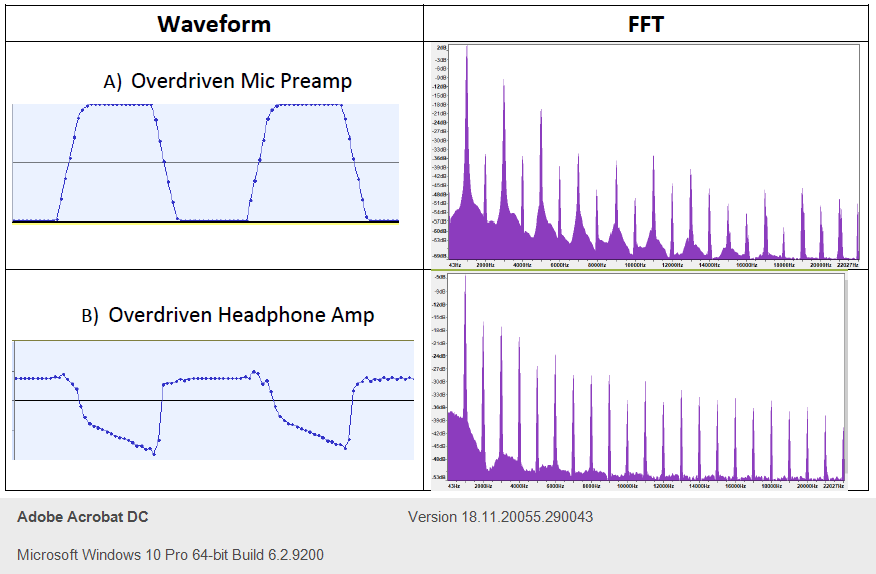
Figure 3 depicts the same 1 kHz sine wave sent through an overdriven microphone preamp (A) and an entry-level headphone amplifier output cranked into distortion (B). The headphone amp is a particularly interesting case, creating a highly asymmetrical waveform. Note the presence of both even and odd harmonics in the signal’s spectrum. Another factor is that the spectrum of a clipped signal depends on the nature of the signal itself. We can’t dive into it here, but a clipped transient behaves much differently than a clipped steady tone.
If you were to look at a clipping plugin in your digital audio workstation (DAW) of choice, you’d likely see a multitude of options and algorithms. Not all clippers provide the same results, and at the peak of the recording industry “Loudness Wars,” plugins that could limit or clip peaks with less audible damage were a hot commodity in the race for hot masters.
Different devices distort in different ways, a concept which is likely at the heart of engineer preamplifier preferences. This means that not all distortion is created equal, and it also means I have to stop teasing my guitar-playing buddy about having so many distortion pedals in his rig. Yeah, right.
The author would like to thank Pat Brown and Langston Holland for their input on this piece.


