Additional Exploration
There are a couple of interesting things to explore here. First, let’s look at how the same EQ parameters can result in different filter curves on different consoles. For this exploration, I’m using a Behringer X32 and a new Allen & Heath SQ-7.
We’re immediately presented with a complication: parametric equalizers on digital consoles allow free and independent adjustment of all three main filter parameters (hence the term “parametric”): frequency, gain, and Q or bandwidth, which describes the width or steepness of a filter’s curve. Bandwidth is stated in octaves (relative) or Hz (absolute), while Q is unitless. Higher Q values correspond to narrower/steeper filters.
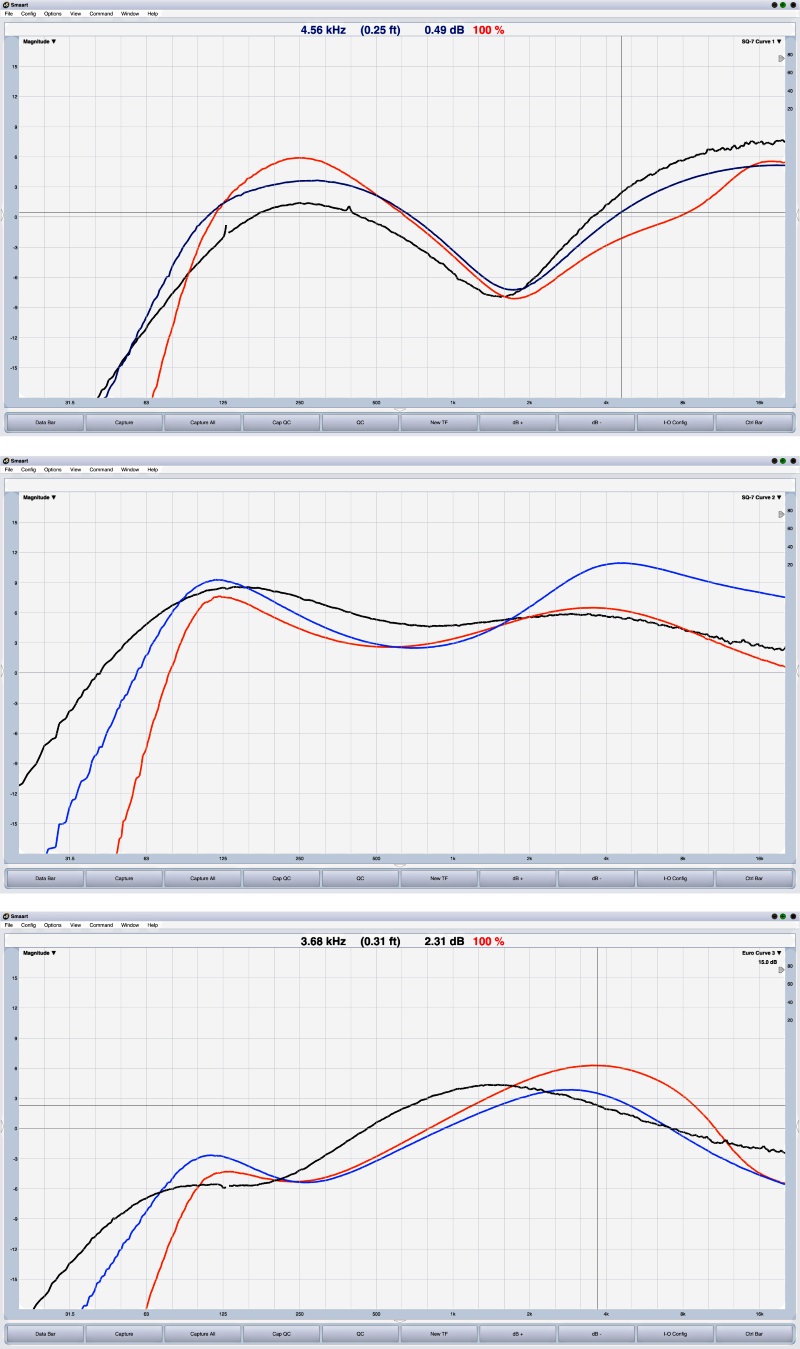
Inputting the analog curves from Table 1 into a digital console means it’s not an apples-to-apples comparison, because the analog desk didn’t offer any control over Q. We do know that the analog desk has very gentle, wide filters so let’s start with low Q settings. Figure 4 shows the resulting curves from the X32 (orange) and SQ-7 (blue) along with the original analog curves in black. I added offsets when necessary to line things up as close as possible, since our interest here lies in the curve shapes, not gain differences.
The general trends are very similar, and the differences here, once again, lie in the details, for example, the HF response in curve 2 and the different peak locations in curve 3. The most pronounced difference between the consoles seems to be the high-pass filter rolloff. Overall, the curves vary by a few dB in places, certainly enough to be audible in a side-by-side comparison, and could form a valid basis for a preference of one console over another.
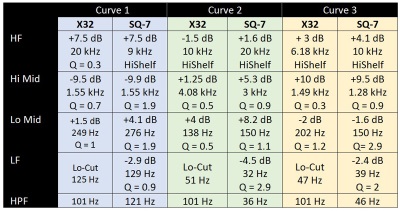
Let’s look at the same situation from the other side: what parameters are required on each console to precisely match the original analog curves? Disregarding gain differences, I was able to get both digital consoles to match the original analog curves within a few tenths of a dB, using the parameters in Table 2. (The SQ-7 indicates filter bandwidth in octaves, which I converted to Q for this table.)
Altogether, these values represent some significant differences, considering the resulting curves are virtually identical. This goes to show that the three basic PEQ parameters don’t necessarily tell us everything when it comes to describing the filter shape.
Developing Conclusions
All of this analyzer business raises the question of how accurately the console’s EQ display reflects reality.
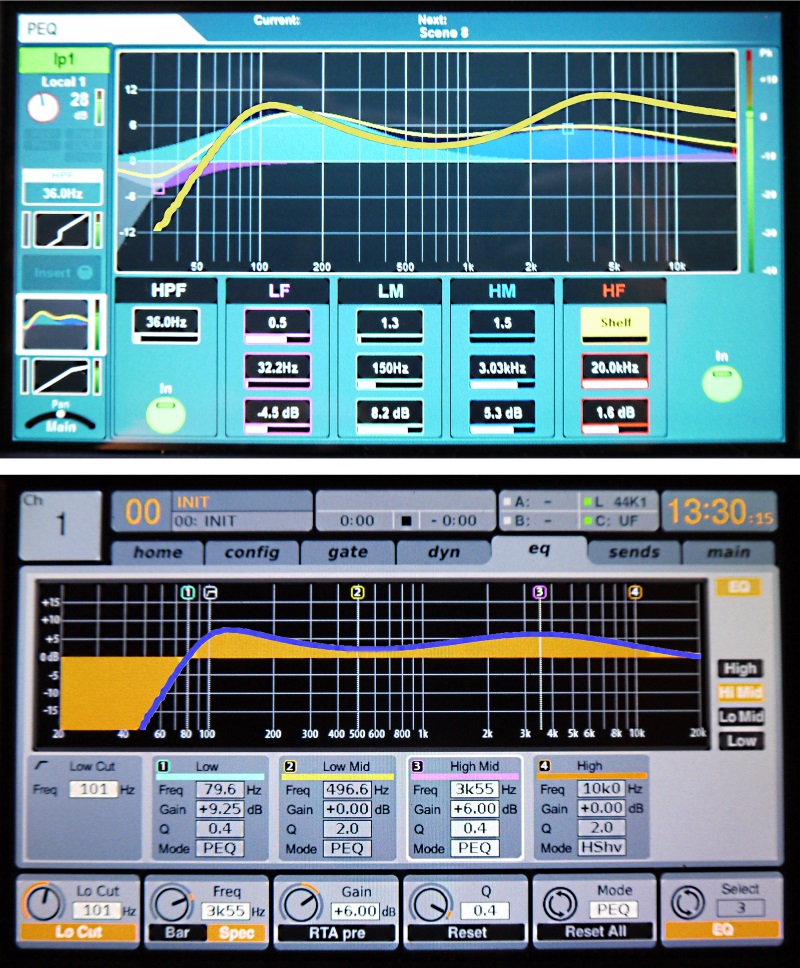
To answer that, I took photos of the console screens, and then scaled and overlaid the Smaart traces on top for a direct comparison. At least that was the plan. I’m discouragingly incapable of using image editing software, so after a good half hour of frustration, I recruited Samantha Potter to do the heavy Photoshop lifting. (Thanks, Samantha!) Figure 5 shows how the X32 display matches its Smaart trace perfectly, while the SQ-7 curve is a little farther off.
In cases where the analyzer trace differs from the console’s display, it would be reasonable to ask why the analyzer should be trusted rather than the console. The answer (well, my answer, at least) is that the console isn’t actually measuring anything. It’s displaying a visual indicator of the parameters of each filter, whereas the analyzer is displaying the measured frequency response of the entire device, the composite transfer function of all active filters.
So what’s the point of all this? Well, let’s start with the points I’m not making. This is not an advocation for – or condemnation of – either analog or digital, or any specific manufacturer’s products for that matter. I chose the consoles for this investigation based on simple availability.
It’s also not a warning that “everything you know about EQ is wrong.” For me, it’s a simple case of knowing more about the tools I use to do my job. One thing I took away from this is that the EQ curve applied to my signal doesn’t always match what I see on the front panel. (A graphic EQ is a prime example of this.) But at the end of the gig, EQ displays are aids, just like RTAs, FFTs, channel level meters and all of the other things on our console that light up.
The final responsibility lies with the operator to use the information provided by these aids, along with knowledge and experience and judgment, to make decisions that best support the artist on stage. It seems to me that we have a higher likelihood of success if we’re clear on what’s happening when we turn those knobs.