
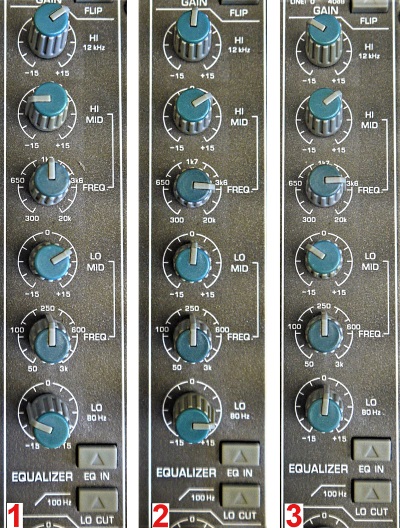
Quick. Before we start, take a look at the channel strip EQ settings in the image below. Grab a pen and paper and try to sketch the curve you think each one would produce. No cheating – don’t look ahead!
Got it? Good.
As several of my fellow LSI contributors have stated in the past, analog consoles are often used in the training process because their layout helps the operator see exactly what’s going on with the signal flow. However, there’s one area in which I think digital consoles really outshine their analog brethren when it comes to training: equalization.
On a digital console, the operator can view the EQ curve on the screen as adjustments are made, which provides an accurate view of what the equalizer is actually doing (or at least a reasonable approximation, as we’ll see). By contrast, analog channel strip EQs are “just a bunch of knobs” and the only visual feedback comes in the form of the labels silkscreened onto the console’s surface.
I’ve come to find that the lack of visualization is often a factor in the difficulty experienced by novice console operators. During training sessions, people start to “get it” once they’ve seen a visual representation of the curve that the EQ creates, even if it’s a small graphic printed in a user’s manual.
The question pops up over and over again: How do you know how to set the EQ? The first part of the equation is all about hearing the tone of the signal and mentally identifying the frequency ranges in question. (For a closer look at this part of the process, be sure to read Samantha Potter’s recent ear training article here from the August issue of Live Sound International.)
The second half is what we’re going to focus on here: How do we understand curve we’re creating at the console? For me, the winning strategy is to trust your ears and mentally visualize the EQ curve you’re adjusting. In a training context, I’ll say, “don’t just twiddle the knobs. Try to picture in your head exactly what the filters are doing as you adjust them.”
This can be tricky at first. But thankfully, we can accelerate that process a little bit.
The Backstory
In 2007, Rane Corporation published Rane Note 167, written by DSP consultant Ray Miller, titled “Why DSP Boxes Set The Same Way Differ.” You can read it for yourself here, but it comes down to the various methods of defining filter parameters.
As just a single example, we generally define the lower and upper frequency bounds of a bandpass filter as the frequencies at which the filter gain has rolled off by 3 dB. This works great, until you need to describe the bandwidth of a filter having less than 3 dB of gain. Approaches in this case vary, and so it follows that filters having different parameter can have differently shaped curves.
On top of that, a DSP programmer may choose any of numerous mathematical functions to implement a desired filter shape, based on design goals. (If you regularly configure crossovers or study circuit design, you’re likely familiar with a few of the variants: Butterworth, Bessel, Linkwitz-Riley, Chebyshev, Cauer…)
Transitioning to the analog world for a minute, channel strip EQ circuits can be designed in a multitude of ways, using different combinations of components and component values, and yielding different filter responses. Put this all together, and we can see that multiple EQs that are “set the same” may not sound the same at all. I have a suspicion that a large portion of any perceived differences between consoles can be attributed to EQ.


