
To ensure that the test signal is analyzed (not the IVA’s spoken reply), the audio analyzer must have a means to trigger on the desired signal. The trigger mechanism may vary by the type of measurement/stimulus. For example, in AP audio analyzers the following trigger mechanisms are used:
• A multitone signal has a unique signature which enables the measurement to trigger on the signal itself with a high degree of success.
• For open-loop measurement, log-swept sine (or chirp) measurements and stepped sine measurements use a sinusoidal pilot tone. The analyzer uses a frequency-selective threshold trigger to locate the pilot tone and the test signal.
• The transfer function measurement has a “match” feature which enables it to trigger on the test signal itself. For signals like music with repetitive phrasing, the user can prepend a short section of a unique signal, such as a maximum length sequence (MLS) to the stimulus, for improved triggering.
Figure 8 shows the stimulus and response waveforms from a smart speaker test using a log-swept sine measurement from 50 Hz to 20 kHz with a 2.0 second sweep length. The 0.2-second-long pilot tone is visible at the beginning of the waveforms.
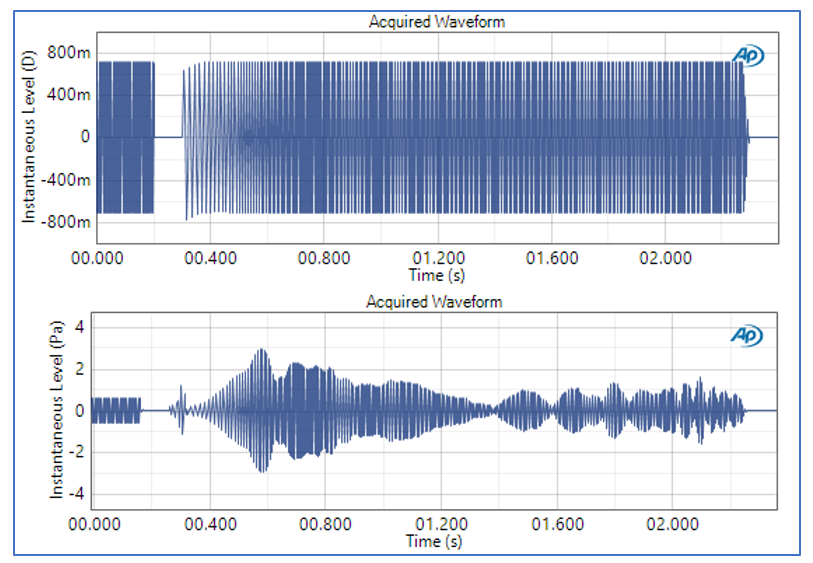
The pilot tone is used not only for triggering, but also to measure the difference in sample rates between the audio analyzer and the DUT. As noted above, the sample clock of the DUT will never exactly match the sample clock of the audio analyzer.
For example, the original signal may have been created at a sample rate of 48.000 kHz, but the DUT sample rate is slightly different – say 47.990 kHz. The sample rates of the two signals must be identical, otherwise artifacts will be introduced in the results. [5] When chirp measurements are conducted in an open loop configuration in APx500 audio analyzers, the system measures the difference in sample rates by analyzing the frequency of the pilot tone. It then re-creates the stimulus signal such that the stimulus and response have identical sample clocks.
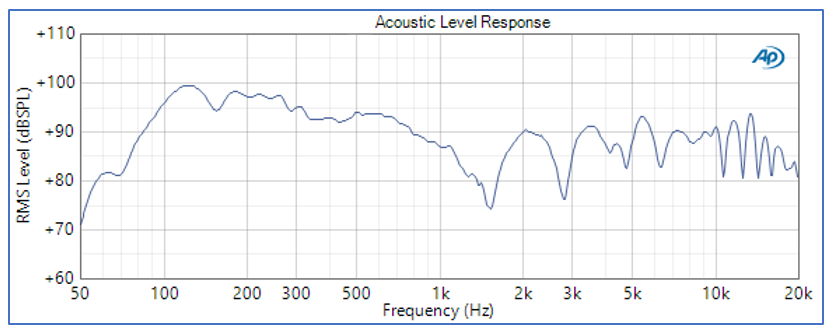
The acoustic level response derived from the stimulus and response waveforms in Figure 8 is shown in Figure 9. Dips in the curve occurring at regular frequency intervals starting at about 1.5 kHz are likely due to acoustic reflections from the table combining destructively with sound waves propagating directly from the speaker to the microphone.
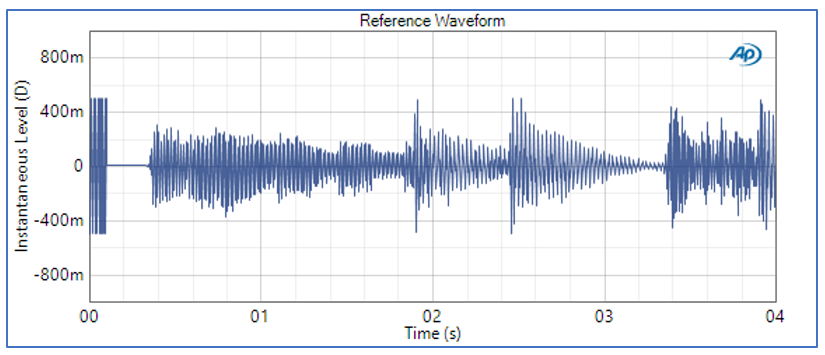
In Figure 10, we see the first few seconds of a music signal used to test the output path of the same smart speaker. The brief 0.1-second-long burst at the very beginning of the waveform is a short MLS signal prepended to the music signal to improve signal matching for triggering.
The frequency response magnitude calculated from analyzing 20 seconds of the music signal is shown in Figure 11. Note that this result is a direct measure of the smart speaker’s sensitivity versus frequency, with units of dB (Pa/FS).
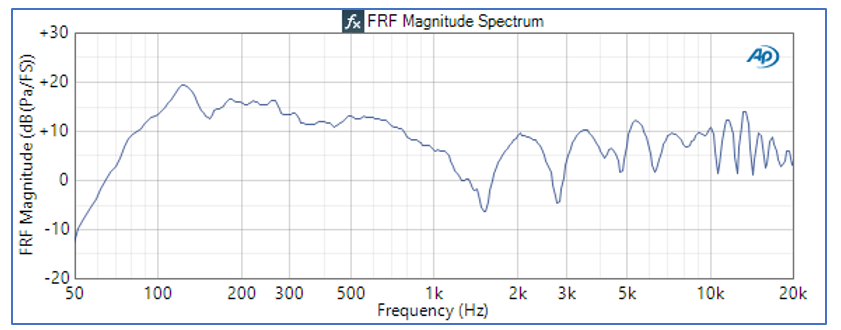
Note the similarity between Figure 9 and Figure 11. Slight differences in shape between the two curves are likely due to the device responding differently to the music signal than a chirp signal at certain frequencies.
Conclusion
This concludes our overview of smart speaker acoustic measurements. We’ve discussed some of the inherent challenges involved in testing smart speakers – both their input and output are acoustic, they must be controlled by spoken commands, and testing them involves interacting with an IVA service and a back-end server.
Despite these challenges, armed with a good audio analyzer and some acoustic accessories, plus a little inventiveness to overcome some of the obstacles, it’s relatively straightforward to make meaningful audio quality measurements of smart speaker devices.
REFERENCES (Part 2)
1. IEEE 1329-2010 – IEEE Standard Method for Measuring Transmission Performance of Speakerphones.
2. Audacity – Free, open source, cross-platform audio software. https://www.audacityteam.org/
3. GoldWave – Digital Audio Editing Software. https://www.goldwave.com/
4. Audio Precision Technote 138 – Transfer Function Measurements with APx500 Audio Analyzers. 2019.
5. Measuring Audio when Clocks Differ. AES Convention Paper 10055, NY (2018).