
Editor’s note: Click here to read the other articles in this series.
The high-resolution dual-channel audio analyzer is a standard front-of-house tool in the modern sound system. There are quite a few versions available, such as Rational Acoustics Smaart, Meyer Sound SIM, SATlive, AFMG Sys-Tune, Metric Halo Spectrafoo, and more.
These tools are common, quite inexpensive, and offer information that’s fairly easy to understand and act upon. It was only a short time ago that the use of such analyzers was extremely rare, controversial, and very difficult to understand.
Modern analyzers have the same basic features, evolving into their present form over about a 20-year period. The common platform is a dual-channel fast Fourier transform (FFT) analyzer with high-resolution quasi-log frequency response that computes the averaged amplitude, phase and coherence response, and a transfer function impulse response.
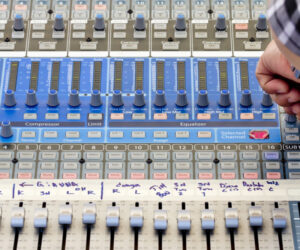
The analyzer is the heart of the analysis system, which also contains an assortment of hardware and peripherals. These include a signal generator, an interface to access the signal flowing through the sound system, measurement microphones and preamplifier(s), an internal delay line, and more.
Software links the analyzer and hardware and manages a library of stored data to be archived for comparison. The primary functions of the system are to provide the data needed for equalization, level setting, delay setting, the aiming of loudspeakers, and identification of acoustical challenges in the room.
Ancient History
To put this in perspective we need to go back to the period before any such type of analysis was in common use. For example, what level of acoustic analysis would have been used when the Beatles played the Budokan in 1966? Virtually none.
At that time there were few acoustic analyzers available beyond a simple sound level meter. An SPL meter reads the level over the entire frequency range. Advanced units could be adapted to limit their readings to selected spectral bands (one at a time).
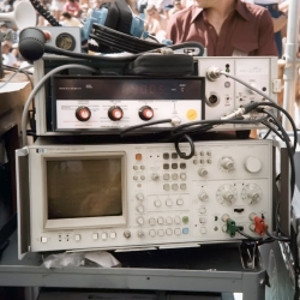
Research facilities would have used an oscilloscope and observed the system behavior with known waveforms such as sine waves. The result could be plotted on a chart recorder after a sine wave sweep.
Such measurements might be conducted in highly professional permanent installations but this was virtually unheard of within the setup of a live show. “Test 1-2” spoken over a mic was the most common form of “acoustic analysis” for live sound systems in those days. Even playing a music track and walking around was harder than you might think.
The standard playback system of the day was a phonograph, which is hardly suitable for sound system testing since they were prone to feedback and instability. Reel-to-reel tape recorders were used by some (very bulky), and then later the cassette tape became common (even worse quality than a modern MP-3 file!)
Into The Mainstream
A new analysis tool, the real-time analyzer (RTA), was introduced in the 1970s. The RTA is basically equivalent to 31 sound level meters running in parallel, each band-limited to 1/3rd octave of the spectrum.
Early versions of the RTA were used by only a limited number of engineers, as they were large and expensive. An early version was made for Altec Lansing by Hewlett-Packard. It’s noteworthy that HP quickly discontinued the product over concerns that it could damage the company’s credibility in the scientific measurement field.
Nonetheless, the introduction of the IVIE IE30 brought handheld analysis into the mainstream. By 1980, the RTA had become the standard tool for analysis and equalization of sound systems for both touring and installed systems. In some ways, professional audio had moved forward into the realm of scientific verifiability with the acoustical analyzer now becoming a major part of system tuning. Unfortunately the RTA provides a very incomplete characterization of the system performance, resulting in an oversimplified perspective regarding equalization.
The most glaring blind spot of the RTA is its inability to measure phase, time or polarity. Needless to say, these parameters greatly affect system performance and create highly audible effects.
The RTA is incapable of discerning direct sound from reverberation or program material from forklift. Simply put, it cannot differentiate signal from noise, showing amplitude over frequency as an integrated value derived from a continuous stream. Integration of sound levels correlates fairly well to our perception of loudness, which is why it’s used in SPL meter readings.
Unfortunately perceived loudness is only one of the parameters required to optimize sound systems. Many optimization decisions are based on time and phase and on the identification of the causes of frequency response aberrations. The RTA’s integration pools the data stream together, which eliminates the ability to read time, phase, and any other information that relates to the order in which a signal is transmitted.
Simply put, the integration of the word “integration” would be the same whether it was read forward (integration), or backward (noitargetni), or sorted alphabetically (aegiinnortt). This obviously modifies the meaning of the word, just as it modifies the musical content of a show, which means that its applicability for optimization is very limited.