Audio signals are, of course, speech and music, and in this article we will examine the nature of those signals in terms of their requirements in bandwidth, dynamic range and normal operating levels.
The nature of peak and average levels of music and speech will be discussed. In addition, we’ll look at the standard methods of dealing with signal peaks and required shifts in signal operating levels.
Audio Spectra
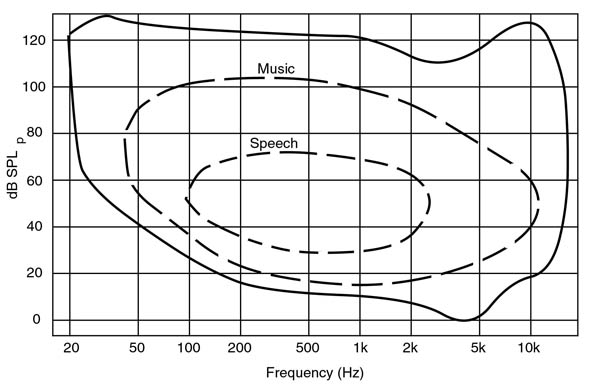
The data of Figure 1 shows the approximate limits of bandwidth and dynamic range of music and speech signals as normally perceived in concert halls and in face-to-face communication.
The outer limit indicates the maximum envelope of audible sound for young listeners with normal hearing. Music occupies a more limited range, especially at higher frequencies. And amplified speech occupies a still smaller range.
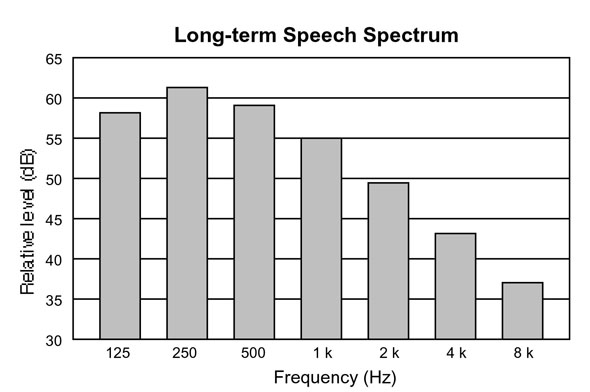
If we were to analyze cumulative speech signals using an octave-band analyzer we would find that a normal adult male speech spectrum would look like that shown in Figure 2. The speech power spectrum has a maximum value in the 250-octave band and falls off both above and below that band. In the range above 1 kHz the falloff is approximately 6 dB per octave.
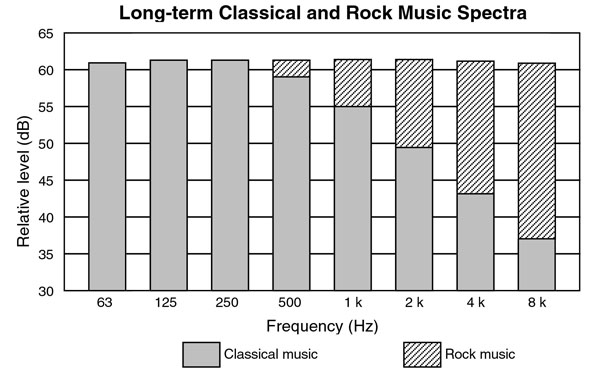
The long-term octave-wide power spectra of classical and rock music are shown in Figure 3. Note that the spectrum of classical music is similar to that of speech at middle and higher frequencies.
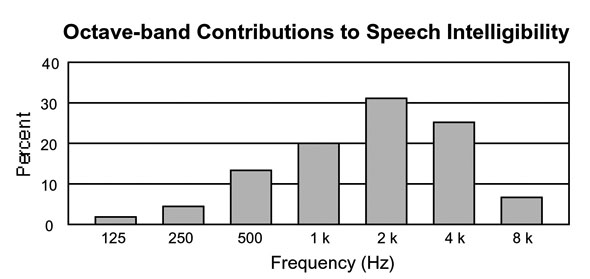
Quite separate from the normal power spectrum of speech is the octave-band contribution to speech intelligibility, as shown in Figure 4. Speech does not have to sound natural in order to be intelligible, as we all know from using the telephone, where bandwidth is limited more or less to 300 Hz to 3 kHz.
As we can see in the figure, the two octaves between 1 kHz and 4 kHz are dominant, and this is why, in very noisy listening environments, sound reinforcement systems are often band-limited to this range. Ideally, we would like for reproduced or reinforced speech to sound both natural and intelligible, and this is certainly possible in reasonably quiet environments.
Intelligibility, Ambient Noise Level
Ideally, the local noise floor should be about 25 dB below average speech levels for the most natural reinforcement of speech. If the ambient noise level in a space is only 15 dB below the speech level, most listeners will have no trouble understanding the message, but many of them will complain about the noise level.
As the speech-to-noise ratio is further reduced there will be a pronounced loss in intelligibility for all listeners, prompting sound system operators to increase the level of the reinforced speech signal. There is a limit to this procedure however.
When is speech level too loud? Normal face-to-face speech communication is in the range of 60 to 65 dB SPL; however, most speech reinforcement systems operate in the range of 70 to 75 dB SPL.
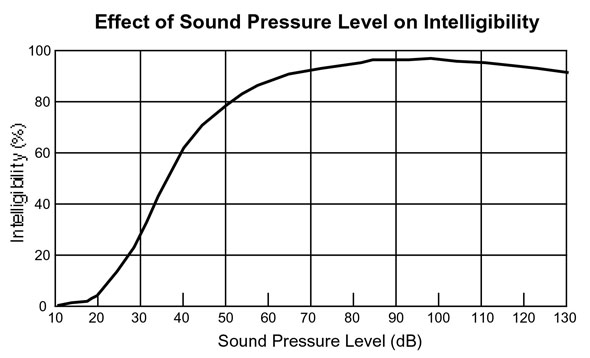
If the level of amplified speech is increased beyond the range of about 85 or 90 dB SPL, there will be little increase in overall intelligibility, and most listeners will complain of excessive levels.
At even higher levels there will be a diminishing of intelligibility as most listeners will literally feel oppressed by the too-high levels. The trend here is shown in Figure 5.
There is an optimum operating range for a speech reinforcement system. For those systems in very quiet surroundings a normal level of 65 to 75 dB SPL is ideal. In progressively noisier environments the system operating level should be raised so that the signal-to-noise ratio is at least 15 dB.
Typical here would be a transportation terminal at peak travel times, where noise levels in the 60 to 65 dB(A) range would call for system operation at peak levels of 80 dB SPL for greatest intelligibility.
Sports venues often present high crowd noise levels in the range of 85 to 95 dB SPL, and under these conditions it is virtually impossible for a speech reinforcement system to work at all. It is better to wait until crowd noise subsides before making announcements.
Matching Speech Levels
We have seen that amplified speech levels must be contained within a fairly narrow range of about 15 or 20 dB for most effective operation, and systems should be designed with this requirement in mind.
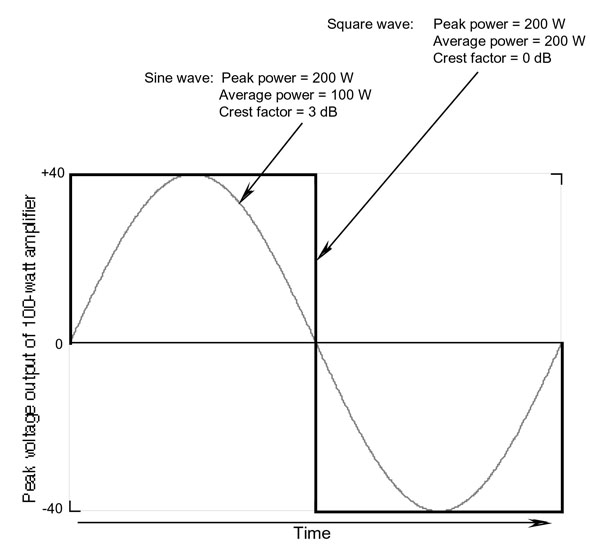
First, we will show the waveforems for sine and square waves of an amplifier capable of delivering 100 watts into an eight-ohm load. Note that full utilization of the amplifier’s voltage drive limits, the sine wave output is 100 watts, while the output of a square wave will be 200 watts.
Why then do we rate this amplifier at only 100 watts? All amplifiers are rated according to their maximum sine wave output capability into a stated load impedance. The sine wave has a 3-dB crest factor (peak-to-RMS ratio), while the square wave has a crest factor equal to unity, as shown in Figure 6.
Since music and speech signals are composed primarily of sine-like waves, the amplifier’s power nominal rating is stated as 0.707, the actual peak output voltage rating of the amplifier, or 3 dB lower.
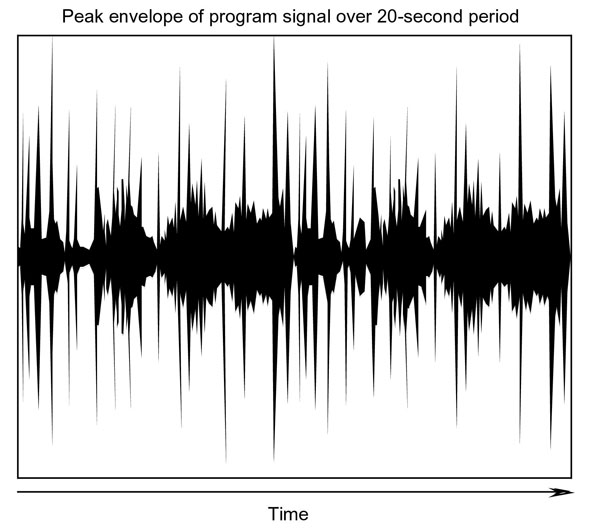
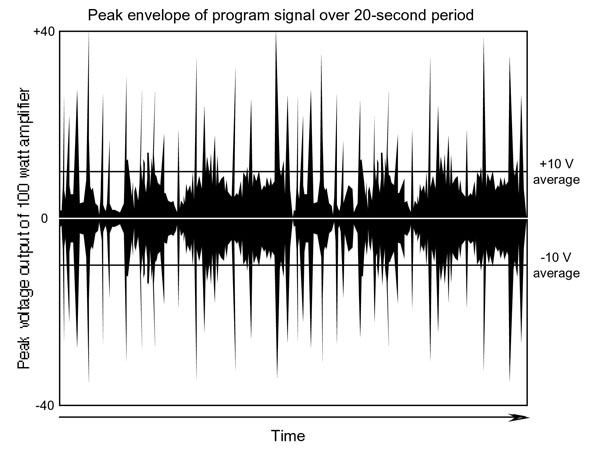
If we actually record a typical speech signal over a period of about 20 seconds, the signal envelope will look much like that shown in Figure 7. You can see that average signal hovers largely around the baseline, with occasional higher values and only rarely reaching the full scale of the figure.
Now, let’s feed this speech signal to an amplifier with an output capability of 100 watts into an 8 ohm load, as shown in Figure 8. We have labeled the left axis with the actual output voltage produced by the amplifier, and we have indicated the approximate average signal voltage at the right axis.
It is clear in this figure is that the average signal output is about ±10 volts, while the full voltage output capability of the amplifier is ±40 volts. The difference here is 12 dB, which corresponds to a power difference of 16 to 1. Stated differently, in order to provide peak output capability of 100 watts for speech signals, the amplifier in question can only deliver an average output of 6.3 watts for normal speech signals.
In order to handle the occasional speech peaks, the amplifier is operating at an average power output of 6.3 watts. This may not be enough power output for effective system operation, and we can solve the problem two ways:
1) Use a larger output power amplifier. For example, a 200-watt amplifier would provide a new average operating level of about 12.5 watts (-12 dB relative to 200 watts). While this might get the job done, it is still an inefficient mode of operation.
2) Peak-limit the input signal so that the normal peak-to-average signal ratio is less than 12 dB. If we do this, a higher average output from the amplifier can be attained.
Signal Peak Limiting, Conditioning
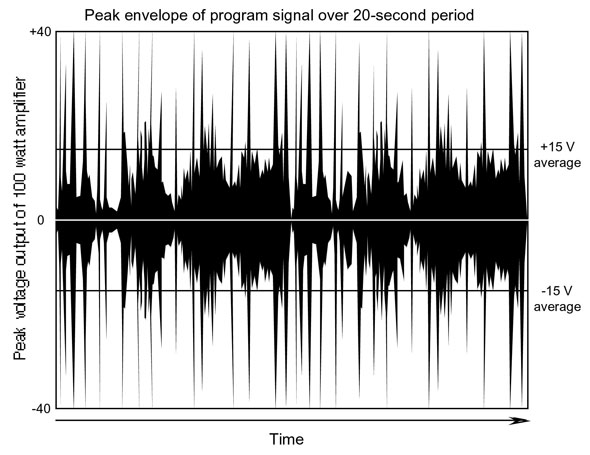
Figure 9 shows the result of limiting the input signal by about 3.5 dB, while retaining the 100-watt amplifier. When this is done, the new peak signals may now be raised so that they correspond to full output of the amplifier.
Values of + 15 volts now correspond to normal signal levels, resulting in a new average power output of 14 watts for normal program.
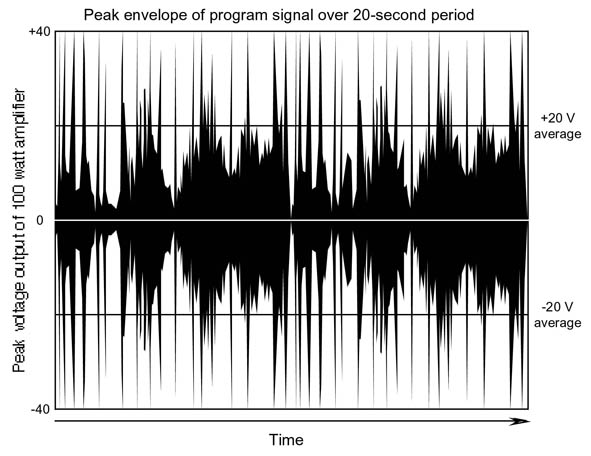
We can extend the process a little further by adding another 2.5 dB of limiting for a maximum of 6 dB signal limiting overall, as shown in Figure 10. Here, we have raised the power available for normal signal levels to 25 watts.
It you study Figures 8, 9 and 10 you will notice that, at each step, the amount of useful “signal space” has effectively doubled. The dark area under the curve is roughly proportional to signal power, and thus relates to perceived loudness.
At the same time, peak levels have remained the same, and this invariably raises the questions: Is the signal limiting we are applying deleterious to the signal? Can you hear it in operation? The answer is mixed; an experienced listener may be able to identify the signal limiting as such, but it will not sound unnatural if it is properly done. The limited signal is louder and as such permits an improvement in intelligibility.
In normal speech applications 12 dB would be about the maximum amount of signal limiting that would be employed. However, for music applications it is customary to provide for a higher degree of signal limiting, plus some degree of compression. Compression and limiting are related operations, and a combination of both enables level manipulations to be made over a fairly wide dynamic range.
An example of the need for both limiting and compression would be a speech reinforcement system in a house of worship where both clergy and lay persons may be called upon to talk. Both experienced and inexperienced talkers will present a wide range of levels at the microphone which can be safely processed by a limiter and compressor in tandem.
Metering in Transmission Systems
Today there are basically two kinds of metering, average and peak. The common VU meter is an example of an averaging meter and as such has nominal rise time and fall-back times of about 0.3 second.
The meter’s rise time is the time taken for a steady-state input signal to the meter to reach 63 percent of its final deflection; the fall-back time is the time taken for the steady-state signal to return from full deflection to 37 percent deflection. Rise and fall-back times are known collectively as the ballistics of the meter.
The original VU meters were passive devices and as such, had ballistic characteristics of a spring-loaded coil with inertia immersed in a magnetic field. Since it is basically an average-reading device, the VU meter has met with continuing success in broadcast work, inasmuch as its readings correspond to the perceived loudness of speech signals.
From their inception, peak program meters (PPM) have been electronic devices an as such can be made to respond very quickly. Typically, a PPM has a rise time of about 10 milliseconds and a fall-back time of about 4 seconds. The rapid rise time permits accurate reading of signals of very short duration, while the slow fall-back time gives the operating engineer adequate time to observe the signal’s value.
Figure 11 shows views of the VU meter (A) and the PPM meter (B). Rise time ballistics of the two types of meters are shown at C.
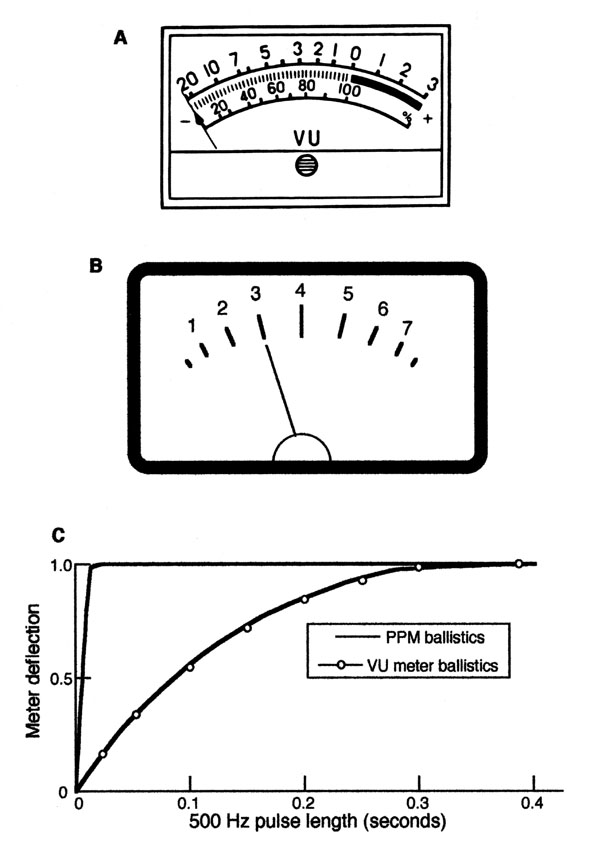
Relative calibration points on the meter faces for four kinds of meters are shown in Figure 12. If both VU and PPM meters are calibrated as shown in Figure 15-12, normal speech program will read maximum values of about +2 or +3 VU, while on the PPM the corresponding readings would be between markers 4 and 6 on the face of the meter, due to the more rapid rise time of the PPM relative to the VU meter.
Gain Structure
As we have seen, normal speech has a peak factor of about 12 dB. Music on the other hand can have peak factors that are in the range of 16 to 20 dB, depending on the nature of the material.
Highly compressed music signals, such as are common in modern pop and rock music may have peak factors no greater than about 4 dB; however, classical music may present numerous operating levels, each requiring recalibration as the program progresses.
Many times during outdoor classical music events at summer festivals the sound reinforcement system is carefully adjusted manually, usually by an operating engineer working with an assistant producer with score in hand.
Figure 13 shows a typical example of how this is done. The engineer must be aware of how loud the orchestra will play and how these loudness peaks will translate through the music reinforcement system.
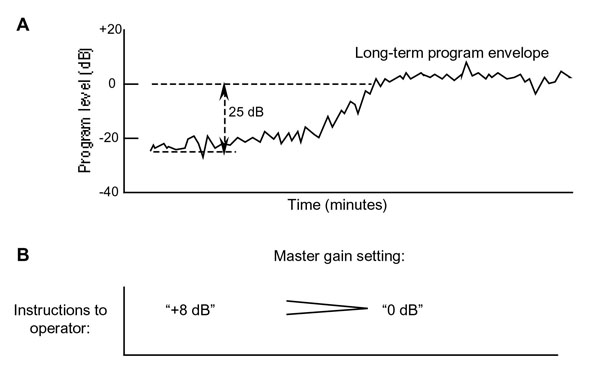
The aim is to contain the peaks within an agreed upon level at selected positions in the large audience area. Such levels as these are often established so as not to produce any disturbance at monitoring points in nearby residential areas.
At the same time, both engineer and producer know that low-level music passages may get lost in the ever-present noise level of large audiences, traffic, overflights and the like. Operating level shifts of the order of 12 dB are very common, and when smoothly executed may be barely noticeable as such.
Dynamic Range Recommended Gain Structure
System headroom and operating levels are normally defined at the line output stage of the operating console, while system noise floor is defined at the microphone input stage.
The total dynamic range of the system is thus established and cannot be improved upon later in the audio chain. However, through careless down-stream gain structure it can be degraded.
As an absolutely safe procedure we recommend that a music or speech reinforcement system be setup to provide a nominal 20 dB of operating headroom over the normal “zero level” calibration. This should apply across the board, so to speak, to all electronic elements in the chain.
Basically, once the headroom value in dB has been determined, the precise relationship between headroom and operating level should be maintained through all following line level electronics.
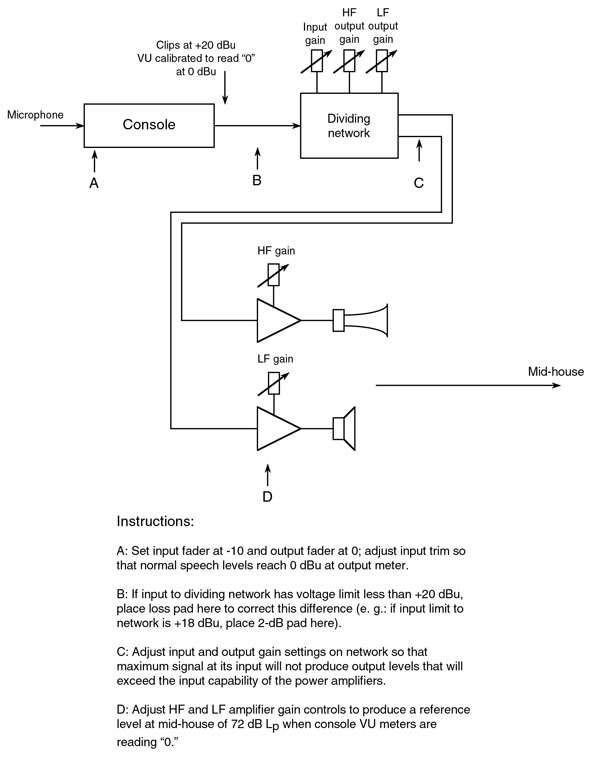
At the end of the chain the power amplifier-loudspeaker combination must be considered as a separate entity, and adjustments made so that a given signal level (e. g., 0 dBu) is assigned a given sound pressure level in the house. This process is shown in Figure 14 for a relatively simple reinforcement system.
Our recommendation is that a VU meter reading of “zero” at the output of the operating console be assigned a nominal level mid-way in the seating space of about 72 dB SPL. You may wish to change this value slightly, depending on local requirements.
This standard approach simplifies normal system operation; all the operator has to do is raise or lower the input fader of the console to attain a nominal zero dB reading in order to ensure consistent speech levels in the listening space.


