As live audio professionals, one of the best investments we can make is a pair of musician’s earplugs. Custom-molded options start at a few hundred dollars, while universal fit models can be had for a few dozen. Whichever type you choose, musician’s plugs are far superior to foam earplugs (colloquially known as “foamies”) when it comes to retaining an accurate perception of your sonic environment.
The idea behind musician’s plugs is that they still attenuate ambient sounds to protect your hearing, but they do so in a way that’s far more even across the frequency spectrum than foam earplugs. I was interested in getting some objective figures on this, so I performed a simple experiment.
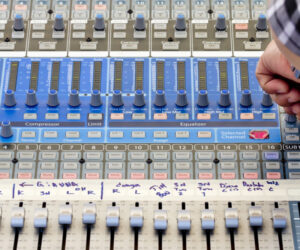
I used a pair of headphones and the oscillator on my digital console to create a “poor man’s audiogram.” In a real audiogram (the most common type of hearing test, also called a puretone test), the audiologist plays a series of sine wave test tones to the subject via a specially calibrated pair of headphones.
Signal levels are decreased to the point of inaudibility, and the audiologist marks these thresholds on a chart. My little setup can’t approach the accuracy of an actual audiogram test rig, but I was able to obtain some information on how both foamies and musician’s plugs affect my hearing.
Basis Of Comparison
An audiogram tests at octave-spaced frequencies from 125 Hz to 8 kHz. I decided to broaden my data set a bit by including 63 Hz at the low end, and 16 kHz up top. Unfortunately, there was some digital aliasing in the test signal at 16 kHz, so I ended up going with 12 kHz instead.
To start, I inserted a new pair of foamies, put my headphones on, and tuned the sine wave oscillator to 63 Hz. I decreased the level while toggling the tone on and off until I felt that I’d reached the lower limit of audibility at that frequency.
I then made a note of the oscillator level setting. On its own, this is an arbitrary and meaningless number, but it is a valid basis for a comparison as long as the headphone level controls are not adjusted in between tests. After working my way up the entire frequency range, I swapped out the foamies for my custom-fit Westone ER-15 musician’s plugs that I’ve had for years and repeated the measurements. Finally, I did the same thing a third time wearing no earplugs at all.
While I’m certainly not an audiology expert, I’ve studied the field a bit, and have learned that day-to-day and test-to-test variations of 5 to 10 dB are to be expected in audiogram results, so a single set of data points is not really sufficient to characterize any result. This is why puretone audiogram results are only taken in 5 dB increments. There’s simply not enough precision to make any meaningful statements about smaller increments. In an effort to account for this, I waited 24 hours and did the entire routine again, taking a second set of data points.
Then I pulled all the data into a spreadsheet and ran a subtraction to find the difference between my wearing the earplugs and my unprotected hearing. This is why the absolute values weren’t critical before: we’re only interested in how the earplugs change things, so we can disregard a bunch of the other factors in this experiment.
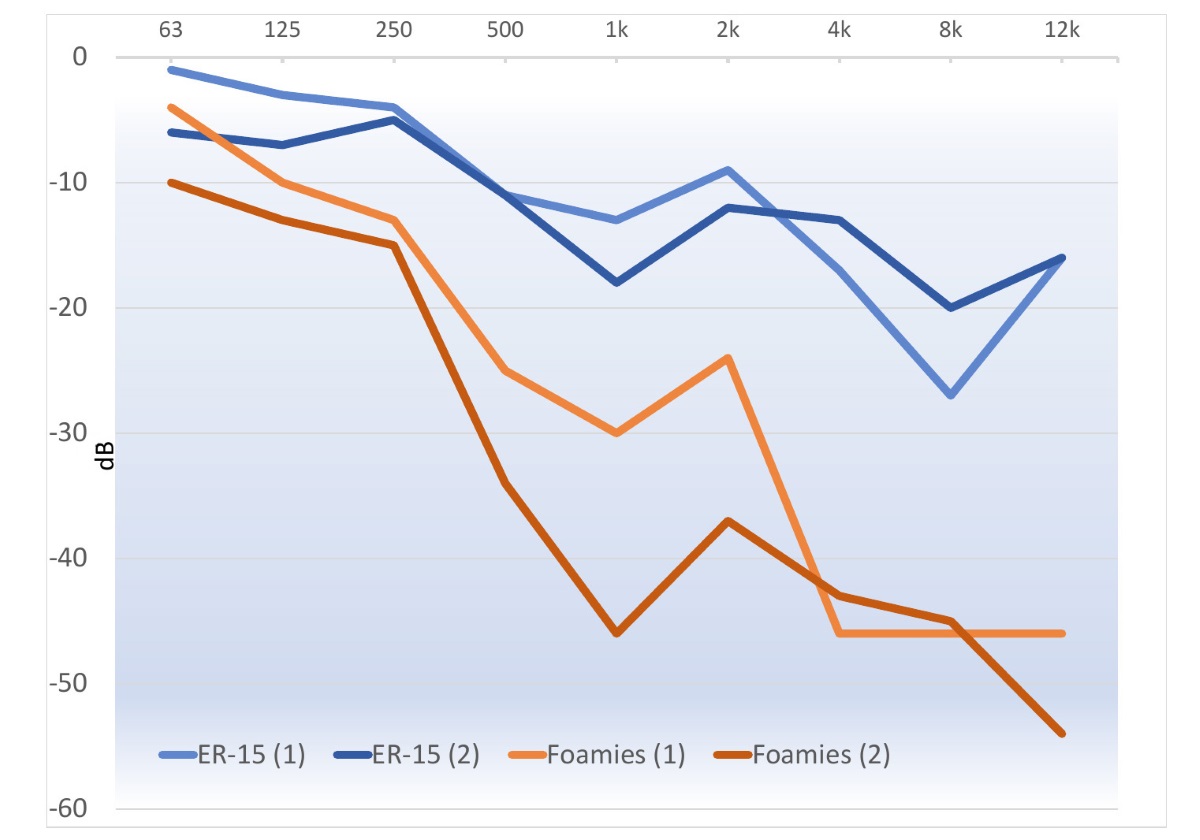
For example, it’s unlikely that the headphones have a perfectly flat frequency response. So it wouldn’t be a valid result if I tried to use these headphones to determine absolute hearing thresholds (like a real audiogram). However, that doesn’t matter for this test because the headphones are not a variable – they’re not changing. Whatever the frequency response is, it’s the same for all three tests, so it’s perfectly valid to look at the differences between each test, which were caused only by the choice of hearing protection. Figure 1 charts the results.
Noting Variations
First, it’s clear that both forms of hearing protection are more effective against higher frequencies. This makes sense, because a given thickness of material represents a relatively larger barrier to the shorter wavelengths associated with higher frequencies.
It’s quite striking just how “tilted” the response of the foamies really is. This is why they’re so disorienting and unpleasant to wear, I think. Upwards of 40 dB of attenuation at higher frequencies is enough to provide complete isolation, to the point of discomfort.
Clearly, we shouldn’t be making any audio-related decisions while wearing these things (other than whether or not to leave the room). The variation between the two plots also confirms something I’ve known for a while, which is that the effectiveness of foamies really depends on how they’re inserted.
The ER-15 musicians plugs offer less attenuation overall, but the response is also far less tilted. It’s much closer to flat, which means we’re hearing a much more accurate representation of the sonic environment. If the response were perfectly flat, it would be like not wearing them at all, only just a bit quieter.
Although it’s standard practice, it doesn’t make sense to specify a single-number dB rating for hearing protectors, because the attenuation varies drastically over frequency, as we can see in the chart. A more descriptive spec should include attenuation over multiple frequencies, perhaps following standard octave band centers described in ISO 266:1997, similar to the way acoustic treatment products are specified.
Significant Disparity
Beyond the single-number issue, there’s a more serious complication: Due to the way hearing protection devices are tested in the laboratory, there’s often a pretty significant disparity between the attenuation values listed on the packaging and what you get in actual use. (Interested readers are directed to the Handbook of Clinical Audiology, 6th Edition, page 690, which cites a few relevant studies.)
Hearing protection manufacturers often describe the effectiveness of their products using a Noise Reduction Rating (NRR). The foam earplug package states “31 dB,” which might seem like a useless bit of information, seeing as we’re getting less than 5 dB at the bottom of the spectrum and about 50 dB at the top. When I averaged all the “foamie” data points, I got 30 dB, which is darn close to what they said on the package.
The ER-15s are stated to achieve about 15 dB attenuation (hence the name) and my results averaged to 11 dB. My molds (and the filters themselves) are almost 10 years old at this point, so it would be fair to assume that the fit and performance aren’t nearly as good as they used to be. Perhaps I should look at a replacement pair. At any rate, it’s good to have a realistic concept about how much hearing protection I’m actually using, which will inform my decisions about exposure limits.
It’s important to note that this is not a rigorous test and should not be used to make any purchasing decisions. These results are not completely representative of what the published materials predict, and it’s likely that the discrepancies are mine, not the manufacturers.
This is just a quick experiment that serves as a jumping-off point, so anyone considering picking up a set of musician’s plugs is encouraged to do more research and consult the manufacturers before deciding on a specific product. It would be interesting to conduct the same type of experiment with a couple types of universal fit musicians plugs to see how they stack up.