
I was recently reading a forum discussion about whether an external microphone is necessary when using a mobile app for RTA/spectrum analysis.
It’s occurred to me that the physical dimensions of the device (cell phone) might cause some significant spectral variance as the phone’s orientation changed relative to the source.
In other words, the RTA response will change depending on how you hold the phone. (Especially if it’s an iPhone 4… Zing!) So I decided to measure it.
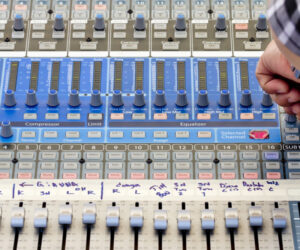
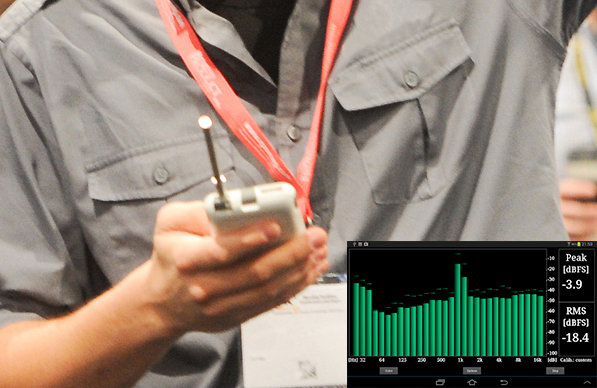
I used my phone to record pink noise playing from a loudspeaker, holding the phone in several orientations. I then ran these recordings through a spectrum analyzer, with Figure 1 showing the result.
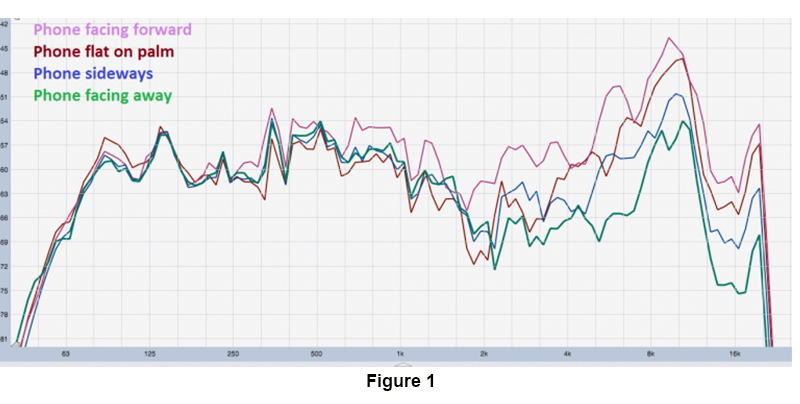
It’s not a flat line, but that’s not really important in this context (although it should cause concern about using this device to inform tonal decisions).
What’s important is how the response changes with orientation. The pink trace is phone facing the source, blue is phone facing sideways, green is backwards, and dark red is phone lying flat (on my palm). Figure 2 offers the same data banded into 1/3 octave bands to show the trends.
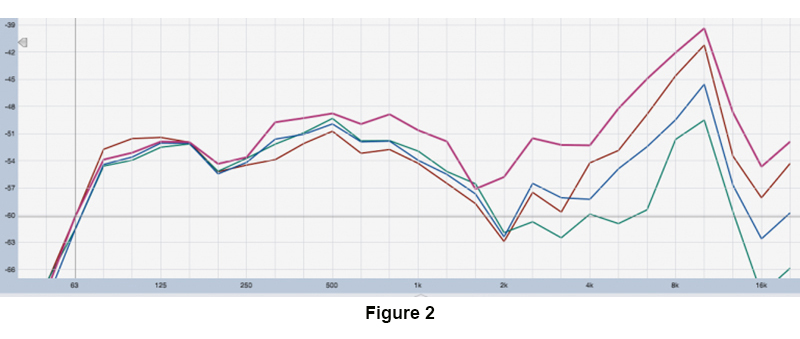
It’s somewhat obvious that the high-frequency response is decreased with rotation – the body of the phone physically blocks short HF wavelengths.
It’s not as intuitive, though, that facing the device straight ahead also gives a wideband boost. This is a boundary effect – the same principle behind pressure zone mics (PZMs) and why subwoofers are “louder” in corners.
At around 630 Hz, the wavelength is starting to get small enough to “see” the phone. (The rough rule of thumb is that we can ignore boundaries that are less than 1/4 wavelength in size, so for a large smartphone, the boundary effect at 630 Hz is right on schedule.)
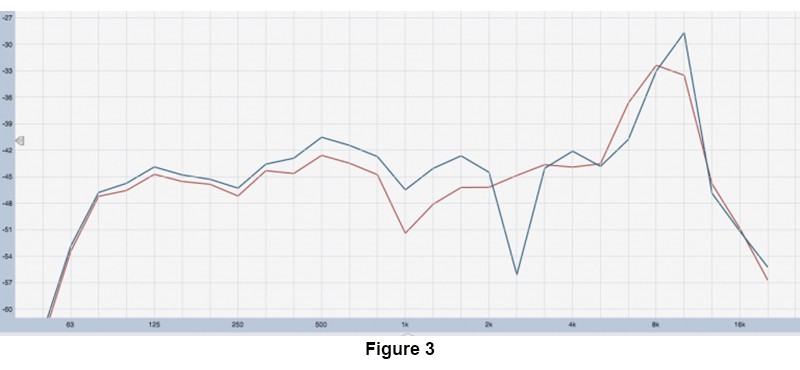
So a larger device – an iPad, for example – should cause boundary effects to a lower frequency than a phone. Figure 3 compares the phone being held “free field” facing the loudspeaker (red) and the same placement only with a tablet pressed against the phone, effectively creating a larger boundary. There’s a reflection off the surface but I used 1/3 octave banding to make the trend clear.
The takeaway here is that we have to be cognizant of the fact that the sound field can actually be changed by the presence of a mic. (Schrodinger, your table is ready.)
The larger the dimensions of the mic body, the more effect we can expect – and to lower frequencies. This is why measurement mics tend to have small, skinny necks. It’s also a good explanation of why the largest deviations in off-axis response found by Ethan Winer in a measurement mic comparison are Radio Shack SPL meters – the device, and the mic diaphragm itself, are both much larger than the rest of the mics in the comparison.
So the answer to “Can I use the built-in mic?” is “It depends what you’re trying to achieve.” A mobile device spectrum analyzer should have no problem accurately identifying feedback frequencies, etc., but I would be very hesitant to use such a device to draw any conclusions about the tonal response of a loudspeaker or mix.
Also note that many models will start to clip around 95 dB SPL or so, and this will significantly change the spectrum, so it’s probably not a show-level solution.