Rather than deal with the legal and logistical challenges of short-range FM transmission, many drive-in concert events in the U.S. are simply opting to fly PA. My friend and touring mix engineer Fletcher McDermott recently reached out to me as he was preparing to mix a drive-in concert, wondering if I was aware of any data pertaining to tuning a PA for folks listening from inside their cars. I replied that I hadn’t seen anything, but it seemed easy enough to measure.
The basic question is a simple one: When audience members are seated inside their vehicles listening to the PA, what effect does this have on the listening experience?
I decided to set up a “mock” drive-in concert – fly a PA and measure it as I usually would, then bring in some vehicles and measure the system’s response from inside the vehicles, and then compare those measurements to the baseline response. If the effects were consistent, it would open the door for the mixer and system engineer to collaborate and make adjustments in the system tuning to offset these effects and create a more desirable (or at least less bothersome) listening experience for the audience members in their vehicles.
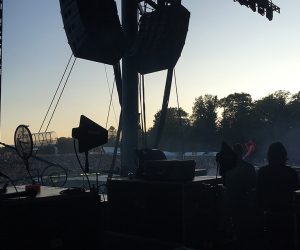
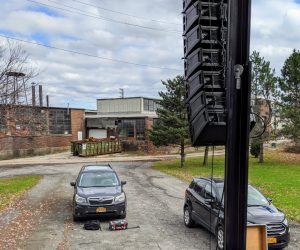
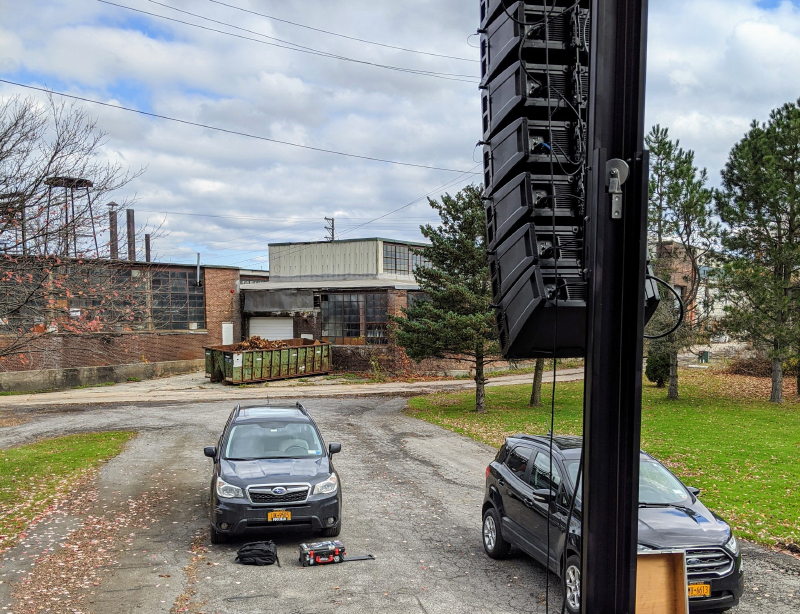
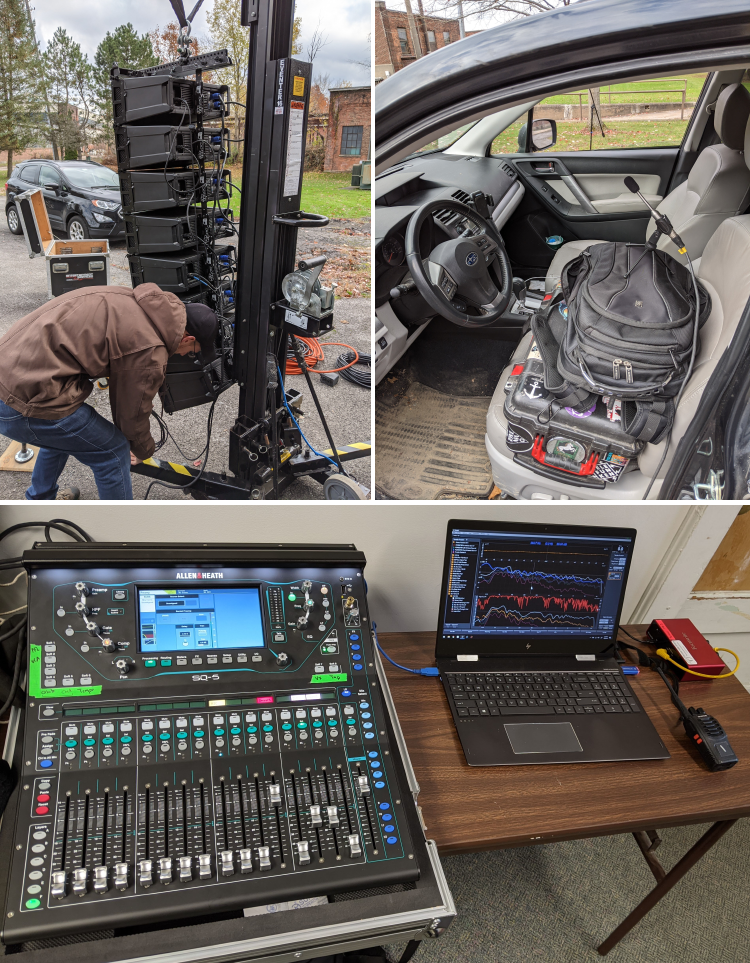
The following day, timing and weather cooperated, so I and fellow system engineer Nate Clark headed over to the shop and set up a mock drive-in concert PA in the back parking lot: a Sumner Eventer lift held a hang of eight RCF HDL6-A compact line array cabinets at a trim height of 16 feet, with a pair of SUB8004-AS subwoofers in cardioid configuration on the ground below (Figure 1). We started by taking a baseline measurement about 50 feet back into the coverage of the PA. Then, the plan was to park a series of vehicles at that same spot, place the mic in the driver’s seat at approximately head height, and observe the changes in the response as measured from inside each vehicle as we worked through various test configurations (all windows open, front windows open, etc).
A note about the measurement data: For each test configuration, we recorded both a transfer function measurement and an RTA spectrum, calibrated for SPL. Since the test signal was pink noise, the RTA response yielded very similar information to the transfer function magnitude response. Due to the lack of direct sound inside a vehicle, the phase and impulse response data was predictably unhelpful. For brevity, we will focus here on magnitude response data.
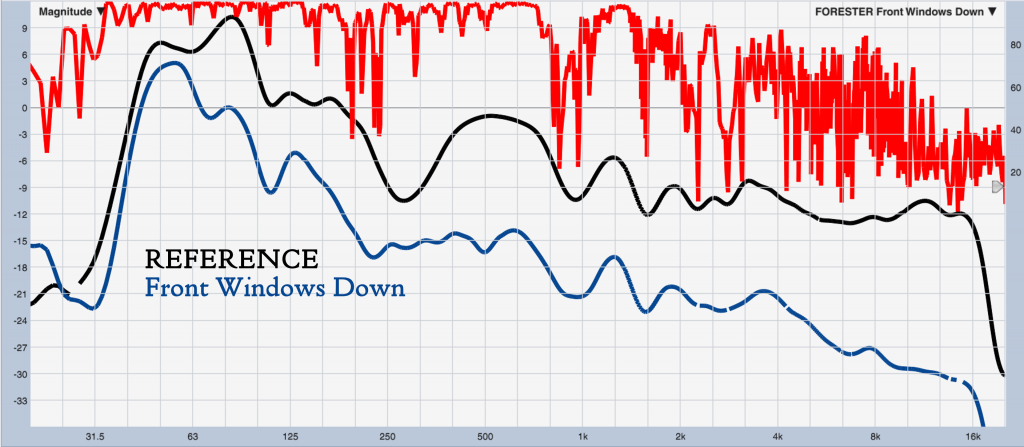
We began our investigation by placing the measurement microphone at head height on the driver’s seat of Nate’s 2015 Subaru Forester, parked in the same spot we used to take the reference measurement, with the front windows rolled down (Figure 2). We see overall attenuation and a HF rolloff, which makes sense intuitively (to me, at least). I will say I was surprised at the gentle slope of the rolloff, extending all the way down to the sub range.
The first question to answer deals with windows: maybe we can get better results by opening all four windows, rather than just the front two. We tried a few configurations (front two windows down, left two windows down, all four windows down, all four windows down and open sunroof, and then mixing in an open rear hatch for good measure), depicted in Figure 3.
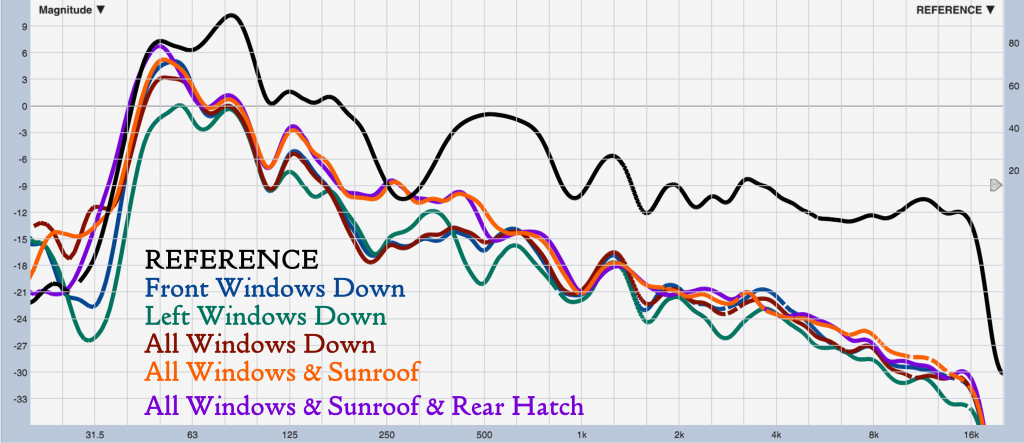
There are only two real deviations from the trend here – first, just opening the left side windows seems to give an inferior result, so it’s probably best to have window open on both sides of the vehicle. (I have a sneaking suspicion this has something to do with the car’s acoustic environment changing from a closed-pipe resonator to an open-pipe resonator model. Opening just the single driver’s side front window caused a virtually identical result.) Secondly, opening the sunroof causes a boost in the response around 300 Hz. Since the PA is flown, the sunroof area is probably getting some direct sound that the side windows don’t. But – by and large – it doesn’t seem like there’s much to be gained by opening up the vehicle to a greater extent.
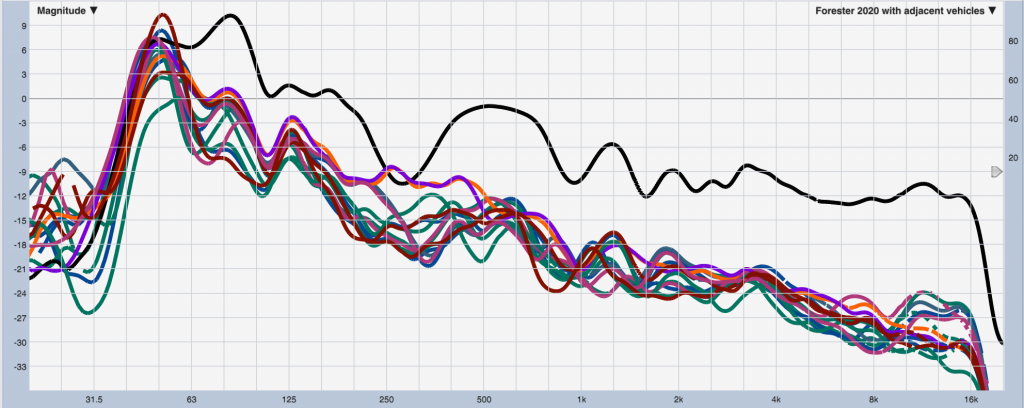
The next factor to address is the degree to which these results are vehicle specific. We tested three more vehicles (a 2020 Subaru Forester, a 2019 Ford EcoSport, and a 2013 Nissan Altima) and the trends held true – opening more than two windows yielded no significant change, with the 300 Hz region being the only range that showed any variation, likely as a result of modal effects within the vehicles’ interiors. Figure 4 shows the data from the additional vehicles overlaid with the previous – the trend is clear and consistent, which bodes well for rule-of-thumb corrective practices. If results varied drastically by vehicle, we’d be dead in the water trying to compensate for it.
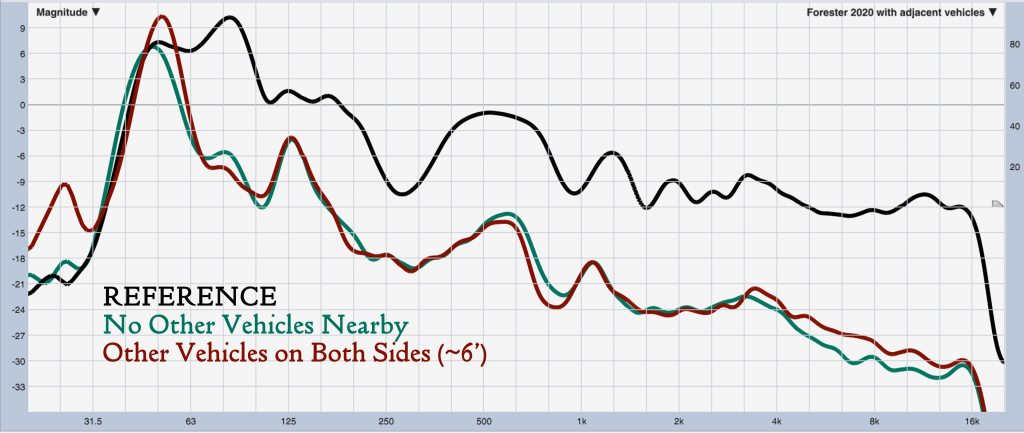
What about the combined effects of several vehicles? When other vehicles are parked alongside yours, does that change your listening experience in any meaningful way? Figure 5 shows the change in response that occurred when we parked vehicles on either side of the test vehicle. Besides the slight increase in the octave around 6.3 kHz, which is likely attributable to HF reflections off the sides of the adjacent vehicles, there’s an interesting bump up in the sub range as well. Without a larger fleet of test vehicles at hand, it’s impossible to say how repeatable or consistent this is.
Although our time was limited, I had one more question I wanted to investigate before we had to pack the rig back into the shop: although opening the additional windows and rear hatch doesn’t seem to provide any real benefit for the people inside the vehicle, does it provide any improvement for the folks in the next row back? Would “please roll down all your windows, for the benefit of those around you” become a new addition to the drive-in pre-show announcement?
It seems not (Figure 6). A vehicle parked in front of the test vehicle does result in some response changes in the low-mid region, but that vehicle’s specific window configuration doesn’t seem to change much of anything.

We can, however, recommend against using a groundstacked PA configuration; the lower angle of incidence of the direct sound in this case means vehicles in front do cause significant occlusion for vehicles further back (Figure 7).
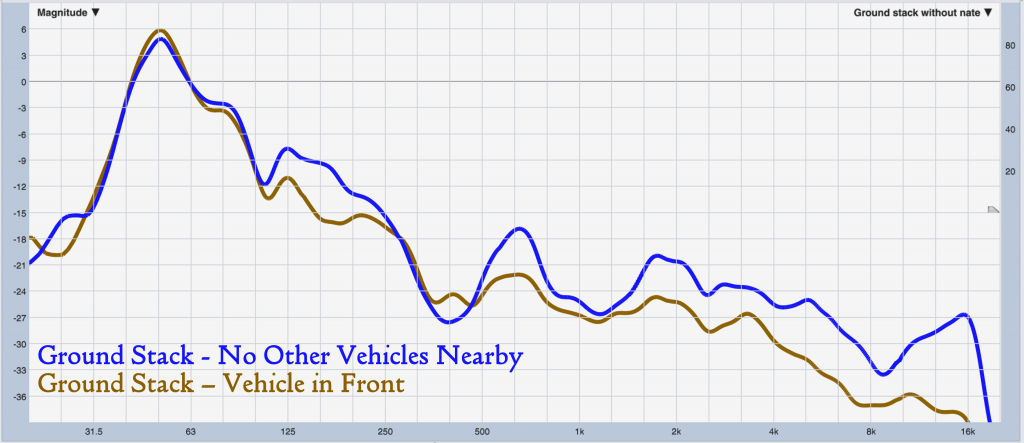
So we definitely want to fly the PA – even the modest 16 foot trim height used in our tests was enough to avoid this issue, so a pair of lifts is a good investment here, with higher trim height recommended for deeper audience planes. Rule of thumb – the PA should have line-of-sight to each vehicle it needs to cover.
So, where do we go from here? This is by no means an exhaustive study, and probably raises more questions than it answers, but it’s a solid starting point for answering our original question, as we have enough data on the general trends here to inform a tuning decision.
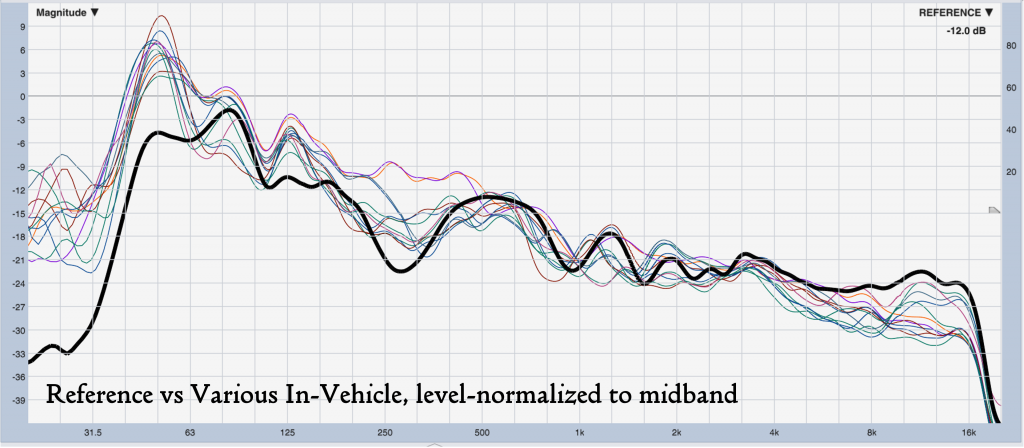
Figure 8 shows what happens if we lower the reference trace level by 12 dB, bringing it in line with the in-vehicle measurements in the midband. We see that, with the level change out of the picture, the real deviations lie at the frequency extremes, above 3 kHz and below 100 Hz. So to offset some of this, one might reasonably consider reducing the sub-range energy by 6 – 9 dB, and reducing the typical HF rolloff of the target curve – in other words, keep the HF response of the rig flatter, because the vehicle windshield will take care of the rolloff for us.
An important element to consider is, of course, the perceptual context. When you’re listening to a concert from within a vehicle, your brain knows you’re inside a vehicle, and so the response changes are normal, natural, and expected. Going too far to offset these changes could result in an unnatural listening experience inside the vehicle.
This is very similar to how I typically choose to address level dropoff and HF absorption from front to back within a venue – completely eliminating it can cause a fundamentally unnatural experience for the folks further back (because their eyes are telling them the source is far way, but we’ve removed some of the acoustic cues that allow the ears to agree). So I personally tend to work to reduce these effects rather than eliminate them completely. The same applies here – my personal approach would be to keep the PA tuned a bit brighter than I would otherwise, but not try to completely restore the missing HF energy.
The final piece of the puzzle lies with the equal loudness contours – down in the sub region, it only takes about a 5 dB change to produce a perceived doubling of level. So the top half of the sub region (50 – 100 Hz) being attenuated by 6 dB or more could cause a shift in perception of the low end and how it relates to the full spectrum.
So by the same logic, tuning the system to completely restore the target curve inside the vehicle may not yield great results once the broadband attenuation of the vehicle body comes into play. Given the aforementioned perceptive “corrections” that a listener’s brain applies subconsciously, I’d be inclined to make only slight reductions in the LF energy taper of the system, and confirm overall response by listening from within a vehicle on show day if possible.
The author gratefully acknowledges Nate Clark, Bill Di Paolo of Entertainment Services NY, and David and Patty Tyler of Advanced Automation Corporation for their assistance with this project.